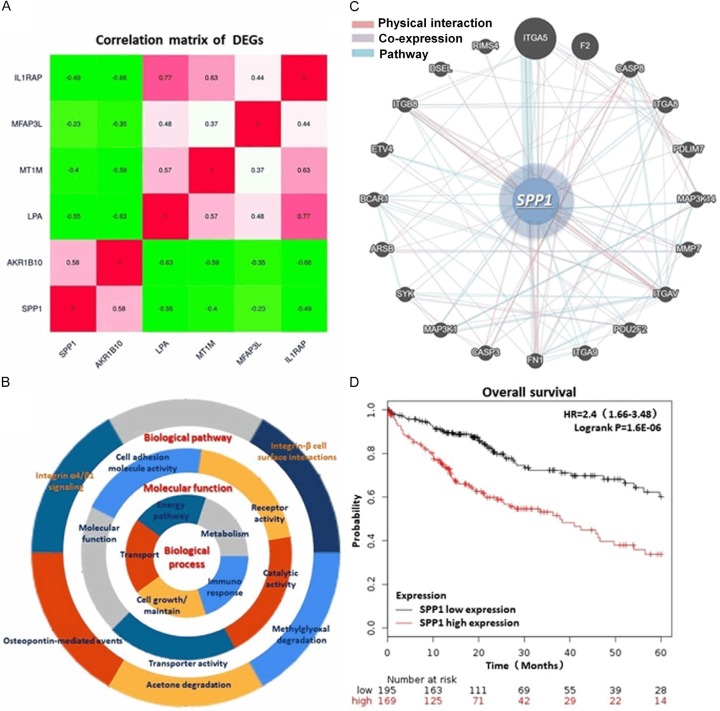
Figure 2.
Correlation and interaction between DEGs and the particular analysis of SPP1. A. Correlation matrix of the DEGs. SPP1 presents a highly expression characteristic in HCC tissues sharing co-expression with another HCC promotor, AKR1B10. B. Presentation of the GO and KEGG enrichment analysis indicating the biological process, molecular functions and biological pathways of the DEGs. C. Network that SPP1 involved in including PPI, co-expression and pathway. D. KM plot of the 5 year OS rate generated from 364 HCC cases demonstraed a significant poor outcome of the patients with relatively higher SPP1 expression (HR=2.4, logrank P=1.6e-06).

