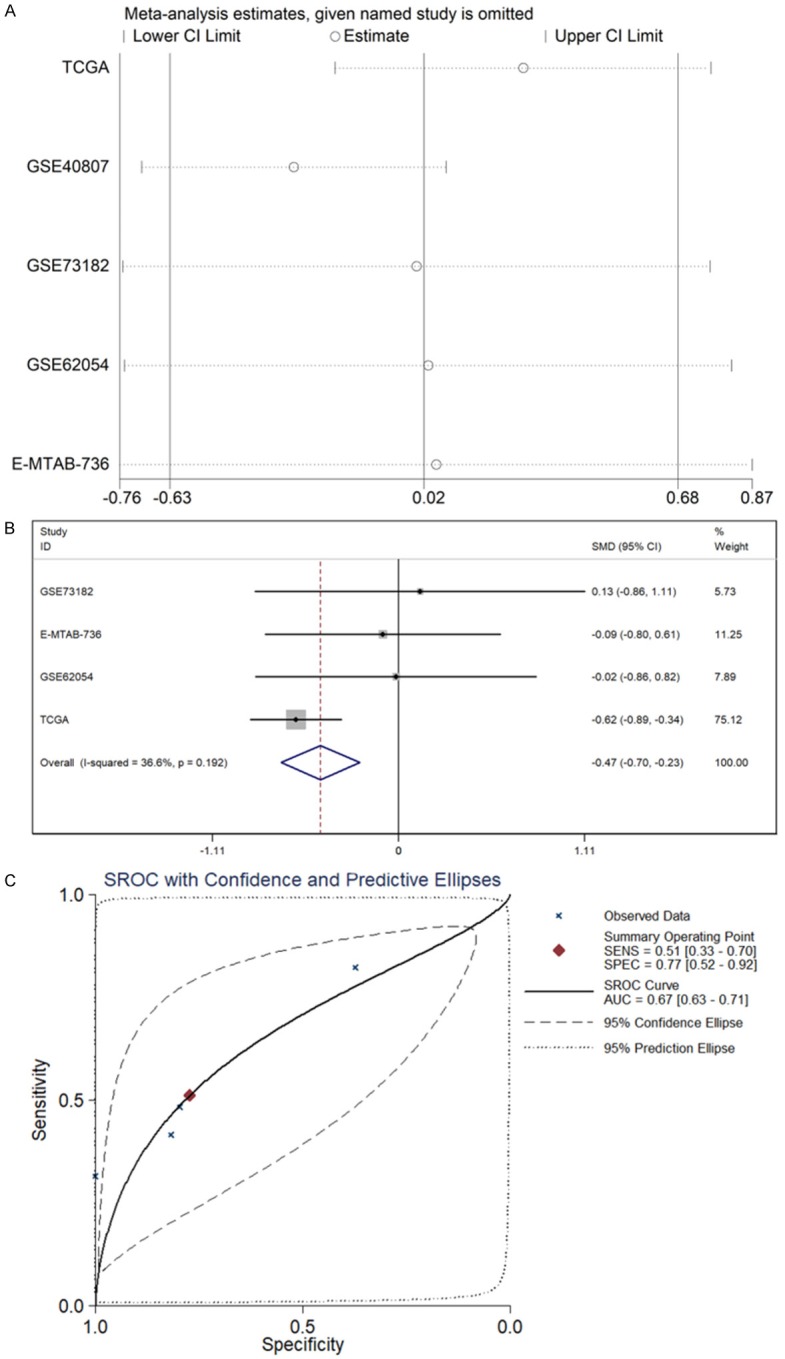
Figure 3.

Meta-analysis based on GEO, ArrayExpress and TCGA datasets. A. Sensitivity analysis was also performed to identify sources of heterogeneity among included studies. B. Forest plot of standard mean difference (SMD) manifests that miR-136-5p has a tendency for low expression in TC. C. The area under the curve (AUC) of the summary receiver operating characteristic (sROC) curve was 0.67.
