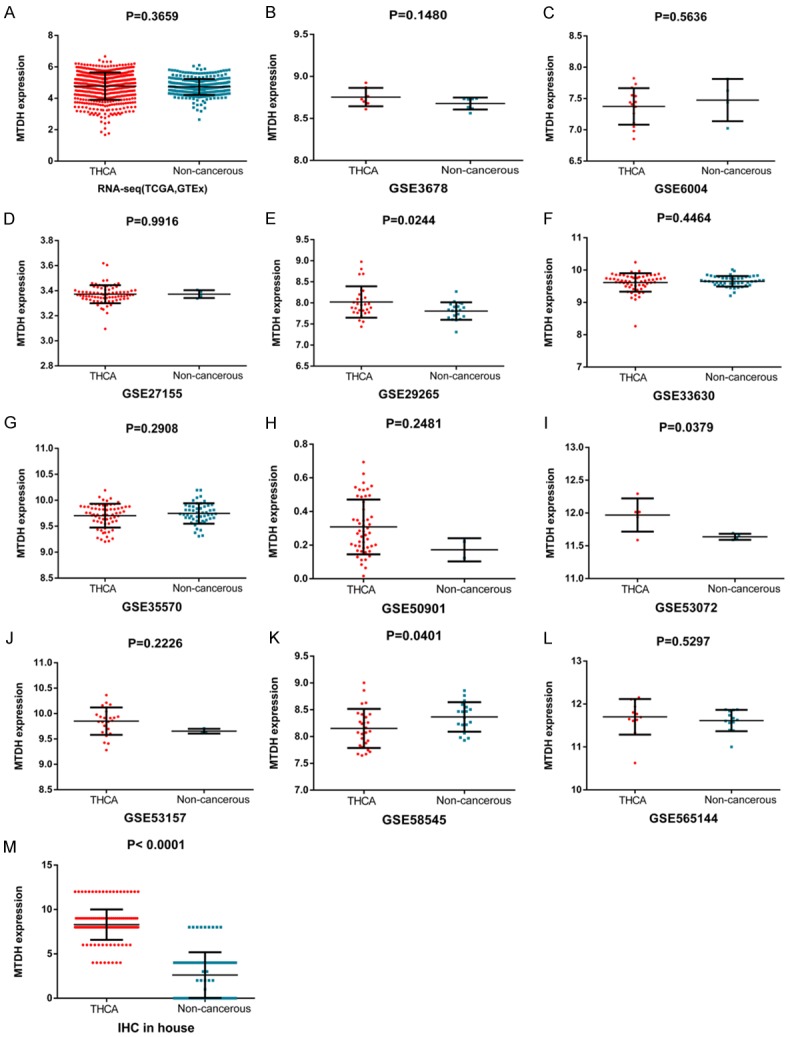
Figure 7.

Scatter plots of MTDH based on various public databases and IHC. MTDH expression was analyzed in each included dataset: TCGA and GETx (A), GSE3678 (B), GSE6004 (C), GSE27155 (D), GSE29265 (E), GSE33630 (F), GSE35570 (G), GSE50901 (H), GSE53072 (I), GSE53157 (J), GSE58545 (K), GSE565144 (L) and IHC in-house (M).
