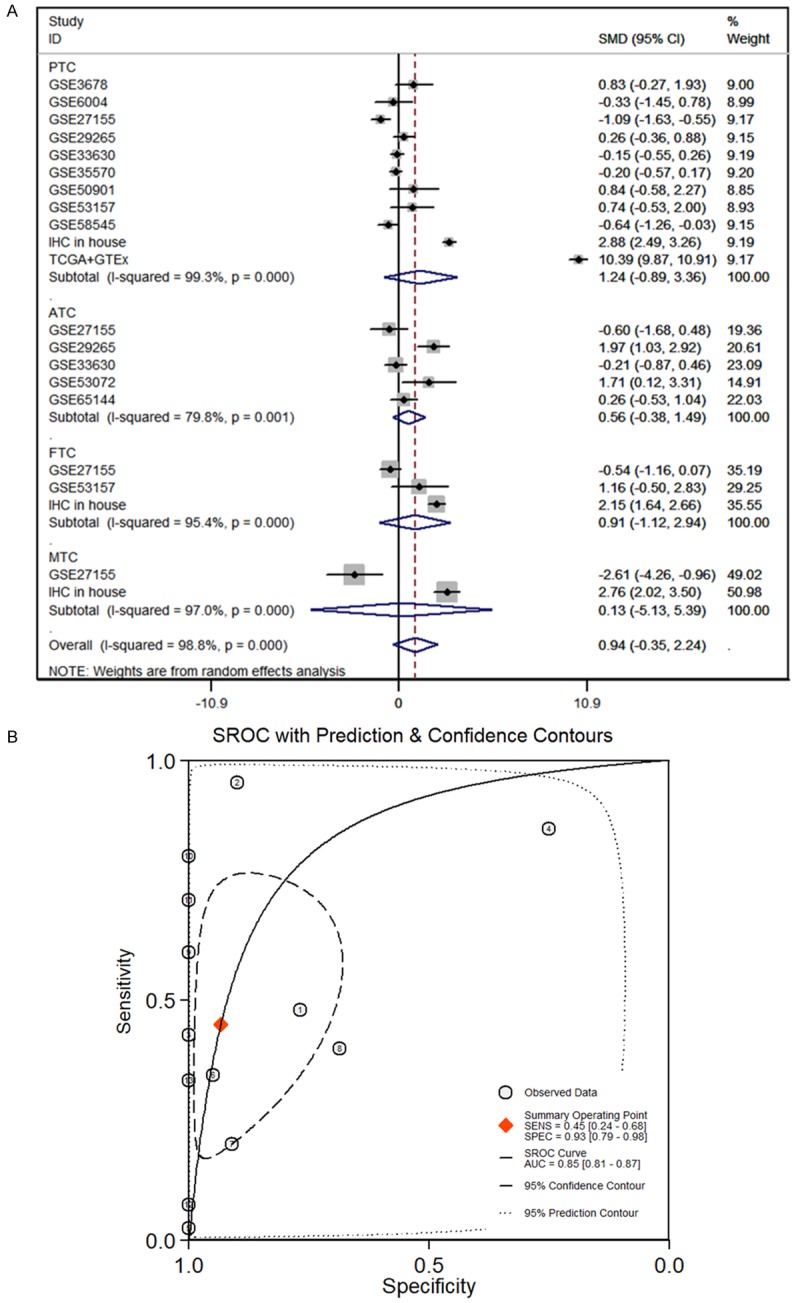
Figure 8.

Continuous variable meta-analysis based on GEO, TCGA and GTEx datasets. A. Forest plot of SMD manifests that MDTH has a tendency for overexpression in TC. B. The AUC of sROC curve was 0.85, which manifested MTDH probably plays an important role in distinguishing TC from non-cancerous tissues. PTC: papillary thyroid cancer; ATC: anaplastic thyroid carcinoma; FTC: follicular thyroid carcinoma; MTC: medullary thyroid cancer; TC: thyroid carcinoma.
