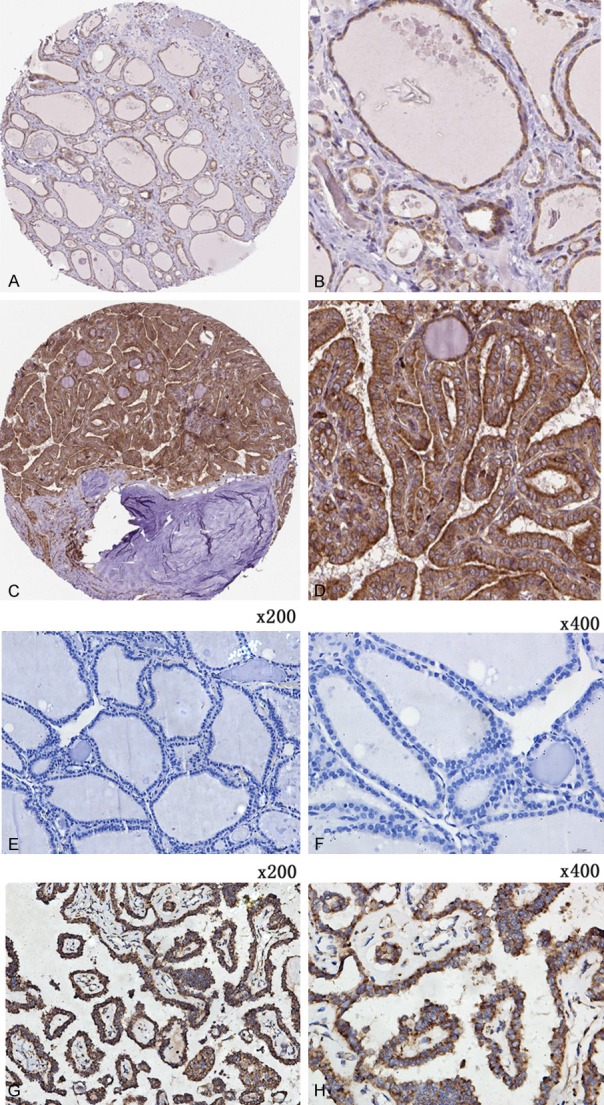
Figure 9.

Representative staining pattern of MTDH in TC tissues and non-carcinomic tissues. The immunostaining images (A-D) were acquired from THPA database and the immunostaining images (E-H) were acquired from the First Affiliated Hospital of Guangxi Medical University. (A, B) Moderate positive of MTDH in the cytoplasm of TC cells. (C, D) Strong positive of MTDH in the cytoplasm of TC tissues. (E, F) Non-carcinomic TC tissues showed weak or no MTDH expression. (G, H) MTDH expression was clearly scanned in the cytoplasm of PTC tissues. The magnification of (E and G) is 200× and the magnification of (F and H) is 400×.
