
Figure 2.
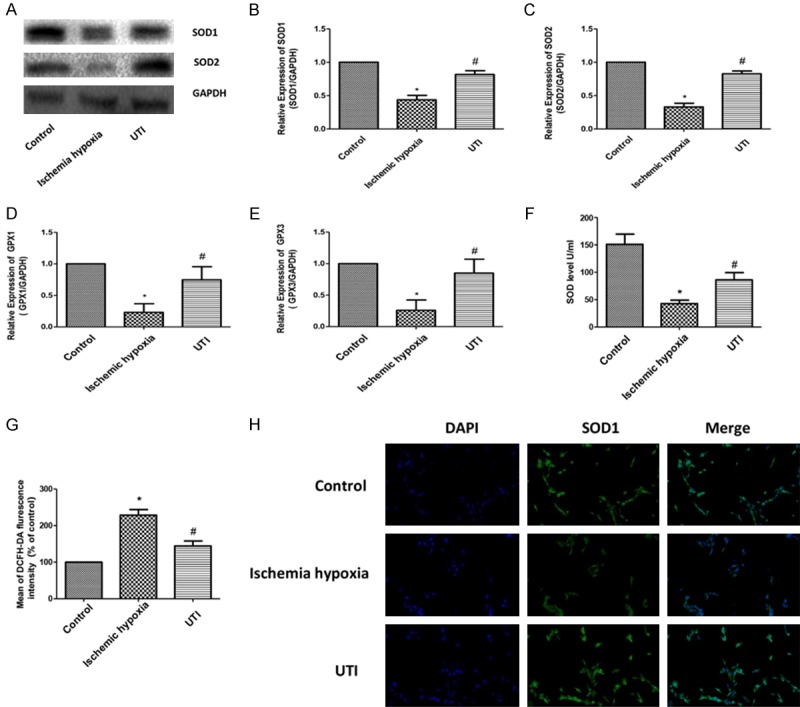
UTI inhibits oxidative stress induced by ischemia-anoxic in H9c2 cardiomyocytes. A. Protein expressions of SOD1 and SOD in three groups are determined by Western blotting. GAPDH is used as an internal control. B-E. The mRNA expressions of SOD1, SOD2, GPX1 and GPX3 in the three groups are determined by real-time PCR. F. SOD activity determined by the SOD activity assay. G. ROS level determined by flow cytometry. H. Positive expression of SOD1 determined by Immunofluorescence in the three groups (100×). (“*” indicates statistical difference from the control group P<0.05 and “#” indicates statistical difference from the ischemic hypoxia group P<0.05).