-
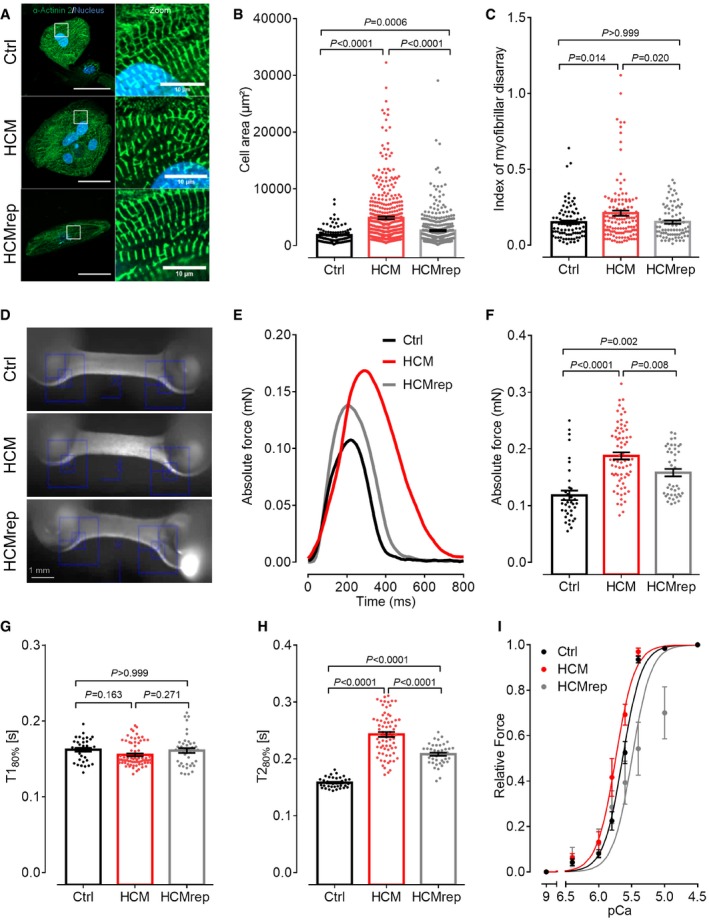
A
Representative immunofluorescence images of the Ctrl, the HCM, and isogenic control HCMrep. HiPSC‐CMs were stained after 30 days in 2D culture with an antibody against α‐actinin 2 and Hoechst for nuclei staining (scale: 50 μm) and with higher magnification (scale: 10 μm).
-
B
Quantification of cell area analyzed with Fiji software [n = number of analyzed cells/wells/differentiations: Ctrl (n = 112/11/3); HCM (n = 424/7/4); HCMrep (n = 443/5/3)].
-
C
Blinded analysis of myofibrillar disarray using high‐resolution pictures [n = number of analyzed sarcomeres/cells/differentiations: Ctrl (n = 90/30/3); HCM (n = 132/44/2); HCMrep (n = 86/29/2)].
-
D
Representative EHTs from each cell line.
-
E
Representative single traces of EHTs in 1.8 mM Ca2+ Tyrode's solution under 1‐Hz pacing at 37°C.
-
F–H
Functional parameters of force (F), time to peak 80% (T180%, G), and time from peak to baseline 80% (T280%, H) were measured under paced conditions at 1 Hz in 1.8 mM Ca2+ Tyrode's solution at 37°C [n = number of measurements/EHTs/differentiations: Ctrl (n = 36/25/4); HCM (n = 64/60/6); HCMrep (n = 41/29/4)].
-
I
Force–pCa relationships were performed with the Aurora 1400A system in skinned EHT muscle strips from respective cell lines [n = number of measured and skinned EHT strips/number of EHTs/number of batches: Ctrl (n = 14/7/3); HCM (n = 10/4/2); HCMrep (n = 7/7/2)]. Concentration–response curves were fitted to the data points, and force–pCa relationship comparison was done by using extra sum‐of‐squares F‐test.
Data information: Data are expressed as mean ± SEM, one‐way ANOVA with Bonferroni's post‐test.