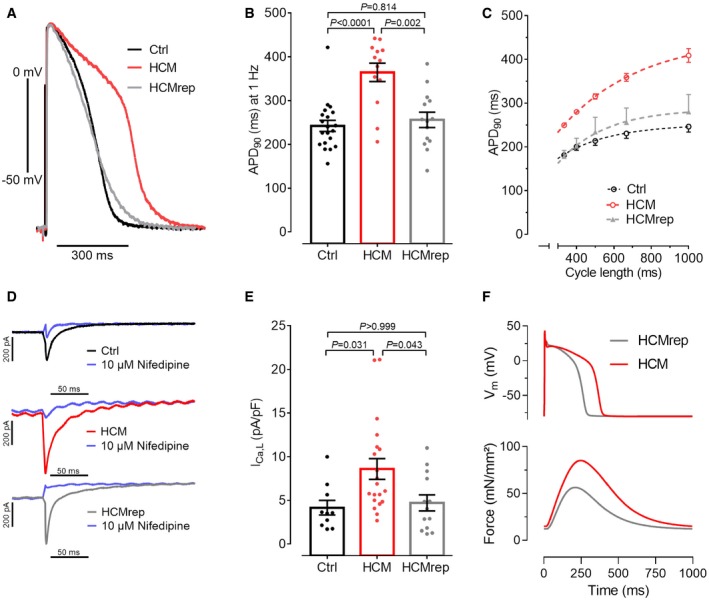
Figure 3. Electrophysiological characterization with 3D‐ and 2D‐cultured hiPSC‐derived CMs.

-
ARepresentative action potentials (APs) measured with sharp microelectrode in EHTs at 1‐Hz pacing.
-
BQuantification of AP duration at 90% repolarization (APD90) of Ctrl, HCM, and HCMrep [n = number of EHTs/differentiations; Ctrl (20/8), HCM (13/6), HCMrep (14/5)].
-
CCycle length dependence of APD90 of Ctrl (n = 7/3), HCM (n = 5/2), and HCMrep (n = 3/1).
-
D, ERepresentative traces (D) and quantification (E) of single‐cell patch clamp recordings of L‐type calcium currents [n = number of isolated cardiomyocytes/differentiations; Ctrl (10/3), HCM (20/3), HCMrep (13/3)].
-
FSimulated effect of 1.5‐fold ICa,L density in in silico model of human hiPSC‐CM AP and Force.
