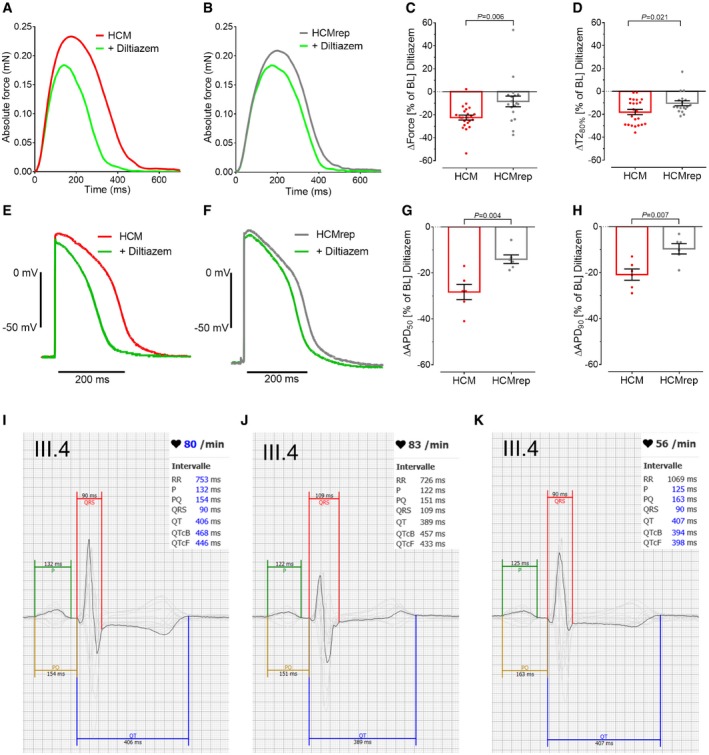
Figure 4. Diltiazem intervention in 3D‐cultured hiPSC‐derived EHT.

-
A, BRepresentative force traces at 1‐Hz pacing under baseline condition and with 3 μM diltiazem in HCM‐ (A) and HCMrep‐EHTs (B).
-
C, DQuantification of the diltiazem effect in percent to baseline (BL) levels for force (C) and time to baseline 80% [T280%, D; n = number of EHTs/differentiations; HCM (n = 23/2); HCMrep (n = 18/2)].
-
E, FRepresentative action potentials (AP) paced at 1 Hz under BL condition (red for HCM, gray for HCMrep) and with 3 μM diltiazem (green) in HCM‐ (E) and HCMrep‐EHTs (F).
-
G, HQuantification of AP duration at 50% (G) and 90% (H) of repolarization in HCM (n = 6/1) and HCMrep (n = 6/1).
-
I–KRepresentative 12‐lead surface ECG with averaged signal and overlay of all leads (in gray, apart from V5 in black) of patient III.4 with different antihypertensive medication: (I) ramipril 5 mg, (J) ramipril 10 mg + 5 mg amlodipine, (K) ramipril 5 mg + diltiazem 180 mg for 1 month (QTcB: QT interval with Bazett correction; QTcF: with Fredericia correction).
