-
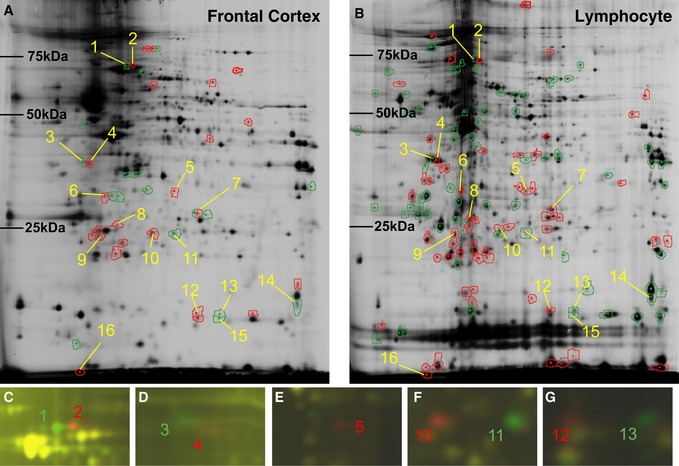
A, B
Results of 2D‐DIGE on frontal cortex tissue (A) and lymphocytes (B). Green and red rings denote spots showing significantly increased expression in B6 and C3H mice, respectively.
-
C–G
Merged images of Cy3 (green) and Cy5 (red): green and red spots represent significantly increased expression of the corresponding protein isoforms in B6 and C3H mice, respectively. Nine (spot nos. 1, 2, 3, 4, 5, 10, 11, 12 and 13) out of the 16 spots were successfully identified as mortalin (Hspa9) (C), nucleophosmin (Npm1) (D), mercaptopyruvate sulfurtransferase (Mpst) (E), peroxiredoxin 6 (Prdx6) (F) and nucleoside diphosphate kinase B (Nme2) (G).
Data information: Significance for differential expression between B6 and C3H was defined as
P value of < 0.05 (unpaired two‐tailed
t‐test) and fold change > 1.2. Yellow numbers indicate the 16 spots that showed consistent alterations between brain and lymphocyte samples from the two mouse strains.
Source data are available online for this figure.