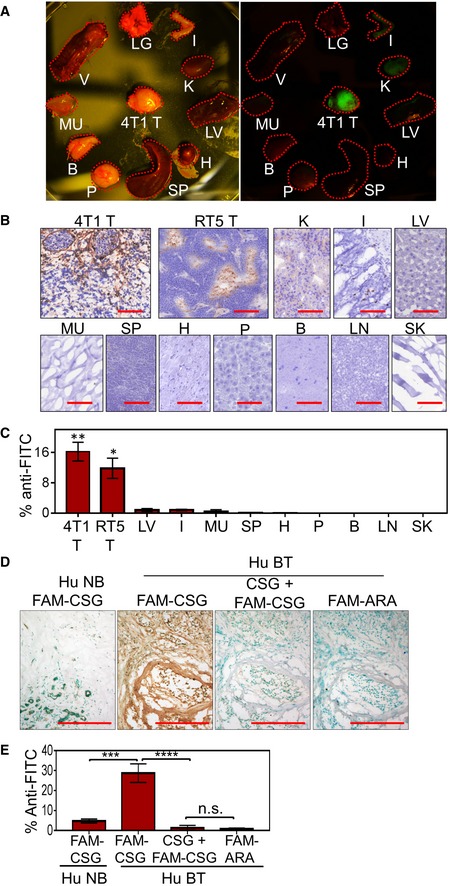
Figure 1. CSG specifically recognises mouse and human tumours, and binds to ECM.

-
A–CMice bearing orthotopically implanted 4T1 breast cancers and RIP1‐Tag5 (RT5) tumours were i.v. injected with 0.1 μmol of FAM‐CSG, and tissues were collected after 1‐h circulation. (A) Photographic image of tissues from 4T1 tumour‐bearing mouse under bright light and UV illuminator. (B and C) Distribution of FAM‐CSG in different tissues including tumours (4T1 T and RT5 T), kidney (K), vertebrae (V), lung (LG), liver (LV), intestine (I), muscle (MU), spleen (SP), heart (H), pancreas (P), brain (B), lymph node (LN) and skin (SK), detected by immunoperoxidase staining with anti‐FITC antibody. Representative staining (brown) is shown for each tissue in (B) and as mean ± SEM of percentage area per tissue section stained with anti‐FITC antibody (n = 3; *P < 0.05 and **P < 0.005, tumour compared to other tissues except kidney by one‐way ANOVA test with Tukey's correction) in (C). Scale bars: 100 μm.
-
D, EHuman breast tumour (Hu BT) and normal breast tissues (Hu NB): 8‐μm serial tissue sections were incubated for 30 min with 1 μM FAM‐CSG or FAM‐ARA, in the presence or absence of 1 mM unlabelled CSG peptide. CSG (brown) was detected as in panels (B and C). (D) Representative micrographs of corresponding tissues stained with anti‐FITC antibody (brown) are shown for an individual patient sample. Scale bars: 150 μm. (E) Bar charts show mean ± SEM of percentage area per tissue section stained with anti‐FITC antibody (N = 4 Hu NB and N = 7 Hu BT; ***P < 0.001 and ****P < 0.0001 by one‐way ANOVA test with Tukey's correction).
Source data are available online for this figure.
