
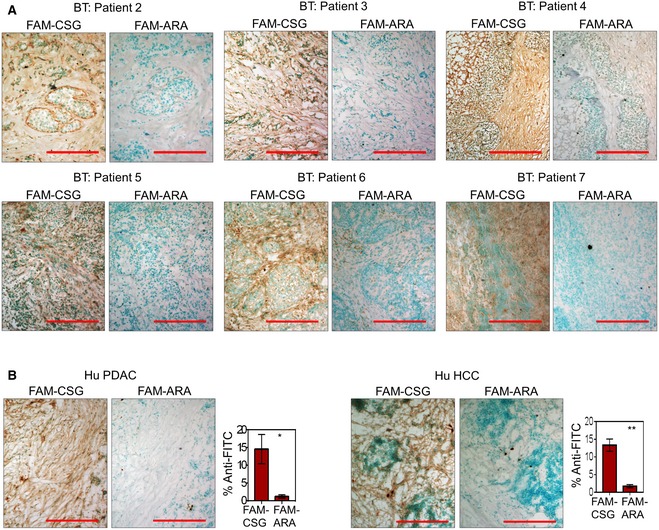
Figure EV1. CSG‐specific binding in human cancers.
-
A, B8‐μm tissue sections were incubated for 30 min with 1 μM FAM‐CSG or FAM‐ARA. Micrographs of corresponding tissues stained with anti‐FITC antibody (brown) are shown for (A) individual breast cancer patients and a representative (B, left) PDAC and (B, right) HCC patient samples. (B) Bar charts on the right show mean ± SEM of percentage area per tissue section stained with anti‐FITC antibody (N = 3 PDAC and HCC patient samples; *P < 0.05 and **P < 0.005 by Student's t‐test).