
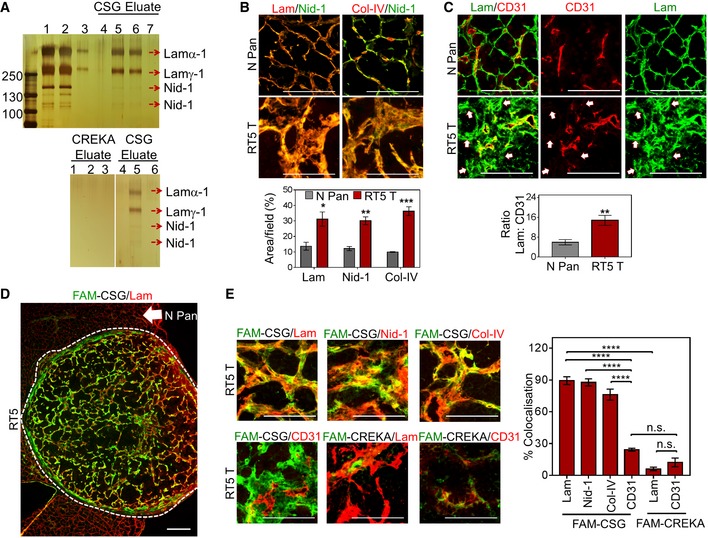
Figure 2. CSG specifically binds tumour ECM with affinity to laminin–nidogen‐1 complex.
Matrigel extract was fractionated by affinity chromatography on CSG‐coupled columns. Bound proteins were eluted with 2 mM CSG or control CREKA peptide solutions and separated by sodium dodecyl sulphate–polyacrylamide gel electrophoresis.
-
ATop: Silver staining shows multiple bands in the Matrigel extract (lane 1), laminin–nidogen‐1 complex (lane 2) and purified laminin (lane 3), in comparison with 4 bands eluted with CSG peptide which did not appear in the first CSG elution (lane 4) but appeared in eluted fractions 2 (lane 5) and 3 (lane 6). These bands were no longer visible in subsequent elution (lane 7). Bottom: Silver staining shows the absence of bands when CSG‐coupled column was eluted with the control CREKA peptide (lanes 1–3); subsequent elution of the column with the CSG peptide shows the 4 previously shown bands (lane 5). The 4 bands (top gel, lanes 5 and 6) were identified by mass spectrometry as laminin subunit α‐1 (Lamα‐1), laminin subunit γ‐1 (Lamγ‐1) and 2 nidogen‐1 bands of 140 and 110 kDa.
-
BNormal pancreas from a C3H mouse (N Pan) and a RIP1‐Tag5 tumour (RT5 T) were stained for the indicated ECM components. Representative micrographs are shown in the top panel. Bar graphs in the bottom panel show quantification of the area positive for each ECM protein (mean ± SEM; n = 3, *P < 0.05, **P < 0.005 and ***P < 0.001 by multiple t‐tests).
-
CTissues as shown in (B) were stained for laminin (lam, green) and blood vessels (CD31, red). Representative micrographs are shown. The bar graph depicts the ratio of laminin over CD31 staining (mean ± SEM; n = 5, **P < 0.005 by Student's t‐test). Arrows: areas positive for laminin expression but lack CD31 staining.
-
DRepresentative micrograph of a RIP1‐Tag5 tumour (T) with normal pancreas (N Pan) showing CSG binding (green; in vitro binding was performed as indicated in Appendix Fig S1E), laminin staining (lam; red) and CSG–laminin co‐localisation (yellow).
-
ECo‐staining analysis of in vitro bound CSG or CREKA (green) compared to indicated ECM markers or CD31+ tumour blood vessels (red). Representative micrographs (left) and corresponding bar graphs (right) show co‐localisation of indicated markers with CSG or CREKA (mean ± SEM; n = 4, ****P < 0.001 by one‐way ANOVA test with Tukey's correction).