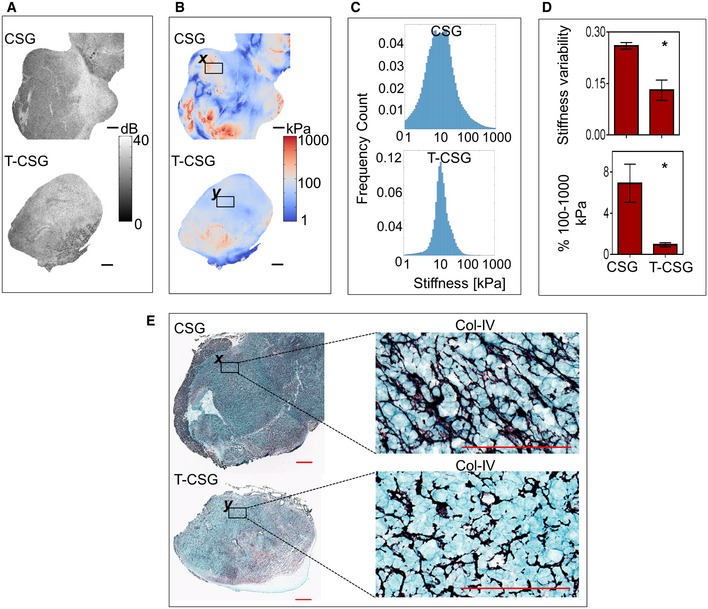
Figure 5. TNFα‐CSG treatment reduces tumour stiffness.

-
AEn face optical coherence tomography (OCT) images of tumours at a depth of ˜100 μm. Scale bars: 1 mm.
-
BThe corresponding en face quantitative micro‐elastograms showing tumour elasticity. Scale bars: 1 mm.
-
CPlots of stiffness distribution in the tumours.
-
DTop: Stiffness variance (see Materials and Methods). Bottom: Fractions of pixels between 100 and 1,000 kPa. For both plots, mean ± SEM is shown (n = 3; *P < 0.05 by Student's t‐test).
-
ECollagen IV staining (purple = collagen) of whole tissue sections. Scale bars: 1 mm and 100 μm. Selected regions (x and y in B and E) were compared for collagen IV staining at higher magnification (E) and the corresponding micro‐elastograms (B).
