
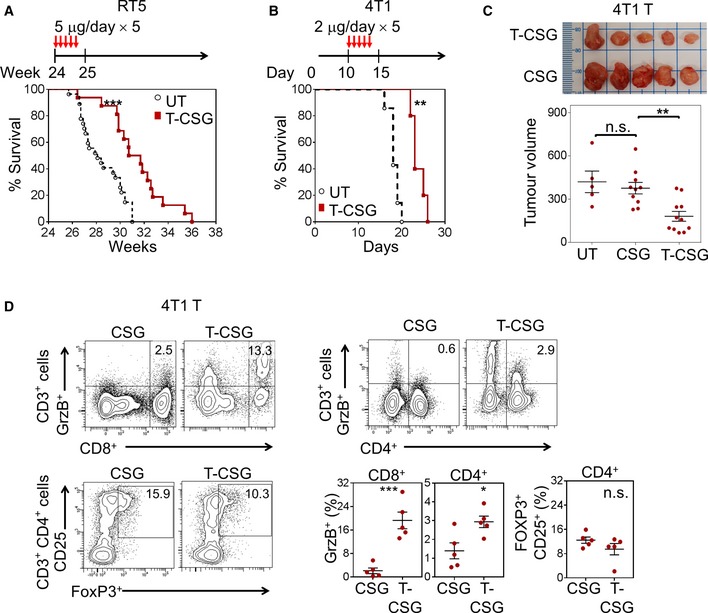
Figure 7. TNFα‐CSG therapy enhances survival, suppresses tumour growth and generates intratumoral effector T cells.
-
A, BPer cent survival of mice bearing RIP1‐Tag5 and 4T1 tumours, either untreated or treated according to the schedule depicted (n = 16–27 for RIP1‐Tag5 and n = 5 for 4T1; **P < 0.001 and ***P < 0.0005 by log‐rank Mantel–Cox test).
-
C4T1 tumour‐bearing mice were left untreated (UT) or treated with indicated compounds according to treatment schedule shown in panel (B). Top panel: Photographic images of excised 4T1 tumours from each treatment group. Bottom panel: Plots of individual tumour volumes (mm3) and mean ± SEM on day 18 are shown (n = 5–11; **P < 0.01 by one‐way ANOVA test with Tukey's correction).
-
DLeft: Representative flow cytometry plots of cytotoxic (Granzyme B+) CD8+ and CD4+ T cells and regulatory (CD25+, FoxP3+) CD4+ T cells isolated from 4T1 tumours of mice treated with 5 daily i.v. injections of CSG or 2 μg TNFα‐CSG (gating strategies in Appendix Fig S3D). Graphs show mean ± SEM fractions of cytotoxic CD8+ and CD4+ T cells and regulatory CD4+ T cells in each treated tumour (n = 5; *P < 0.05 and ***P < 0.001 by Student's t‐test).
Source data are available online for this figure.