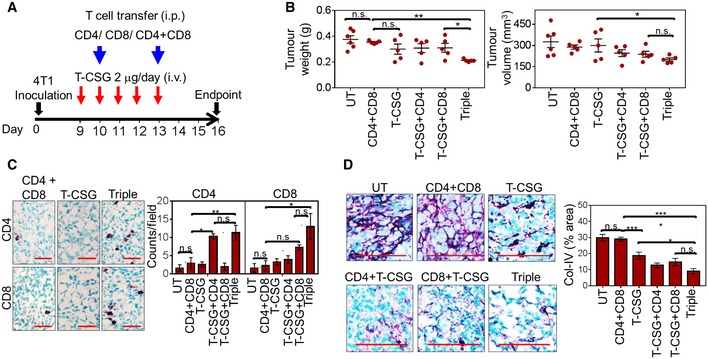
Figure 8. CD8+ and CD4+ T cells mediate ECM degradation and anti‐tumour effects of TNFα‐CSG.

-
ABALB/c nude mice bearing 4T1 tumours were treated with 5 daily i.v. injections of TNFα‐CSG in the absence or presence of naïve splenic CD4+ and CD8+ T cells, or both (triple treatment). The cells were injected i.p. on days 10 and 13. On day 16 post‐implantation, the tumours were analysed for weight and volume (B), immune infiltrates (C) and collagen IV content (D).
-
BPlots of individual tumour weights (g) and volumes (mm3) and mean ± SEM on day 16 are shown for untreated (UT) and treated groups (n = 5; *P < 0.05 and **P < 0.005 by one‐way ANOVA test).
-
CLeft: Micrographs show CD4+ and CD8+ T cells (purple) counterstained with methyl green in tumours from the indicated treatment groups. Scale bars: 40 μm. Right: Bar charts show mean ± SEM of CD4+ and CD8+ T‐cell counts/field (n = 3; *P < 0.05 and **P < 0.005 by one‐way ANOVA test with Tukey's correction).
-
DLeft: Micrographs show representative collagen IV (Col‐IV) expression (purple) counterstained with methyl green in untreated and treated tumours. Scale bars: 25 μm. Right: Bar charts show mean ± SEM of collagen IV staining/field (n = 5; *P < 0.05 and ***P < 0.001 by one‐way ANOVA test with Tukey's correction).
Source data are available online for this figure.
