-
A
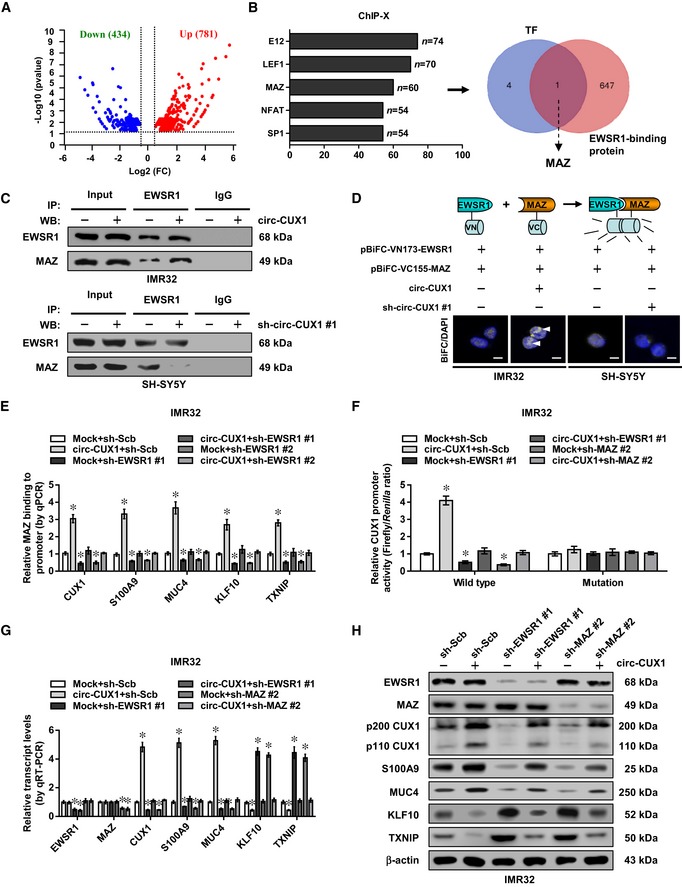
Volcano plots indicating RNA‐seq results of 781 up‐regulated and 434 down‐regulated genes in IMR32 cells upon stable circ‐CUX1 over‐expression (fold change > 1.5, P < 0.05).
-
B
ChIP‐X analysis (left panel) showing top five transcription factors regulating the altered genes, and Venn diagram (right panel) indicating the identification of MAZ by over‐lapping analysis of five transcription factors and EWSR1‐interacting proteins derived from BioGRID database.
-
C
Co‐IP and Western blot assays showing the interaction between EWSR1 and MAZ in IMR32 and SH‐SY5Y cells stably transfected with circ‐CUX1 or sh‐circ‐CUX1 #1, respectively.
-
D
BiFC assay revealing the interaction (arrowheads) of EWSR1 and MAZ in IMR32 and SH‐SY5Y cells stably transfected as indicated, with nuclei stained by DAPI. Scale bars: 10 μm.
-
E
ChIP assay showing the binding of MAZ (normalized to input, n = 5) to target gene promoters in IMR32 cells stably transfected as indicated. One‐way ANOVA, *P < 0.05 versus mock+sh‐Scb.
-
F
Dual‐luciferase assay revealing the relative activity of p200 CUX1 promoter with wild‐type or mutant MAZ‐binding site in IMR32 cells stably transfected as indicated (n = 5). One‐way ANOVA, *P < 0.05 versus mock+sh‐Scb.
-
G, H
Real‐time qRT–PCR (G, normalized to β‐actin, n = 5) and Western blot (H) assays showing the expression of EWSR1, MAZ, and their target genes in IMR32 cells stably transfected as indicated. One‐way ANOVA, *P < 0.05 versus mock+sh‐Scb.
Data information: Data are presented as mean ± SEM. Exact
.

