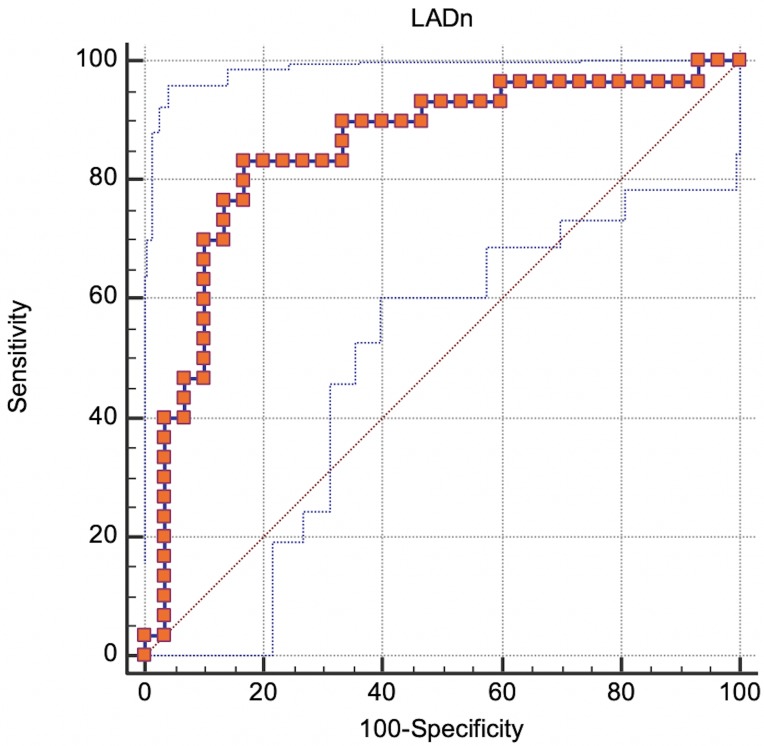
Fig. 5.
ROC curve analysis: true positive rate (Sensitivity) plotted in function of the false positive rate (100-Specificity) for different cut-off points. 95% confidence bounds were also reported (blue dot lines). Each point on the ROC curve represents a sensitivity/specificity pair corresponding to a particular decision threshold. A test with perfect discrimination (no overlap in the two distributions) has a ROC curve that passes through the upper left corner (100% sensitivity, 100% specificity). Therefore, the closer the ROC curve is to the upper left corner, the higher the overall accuracy of the test.

