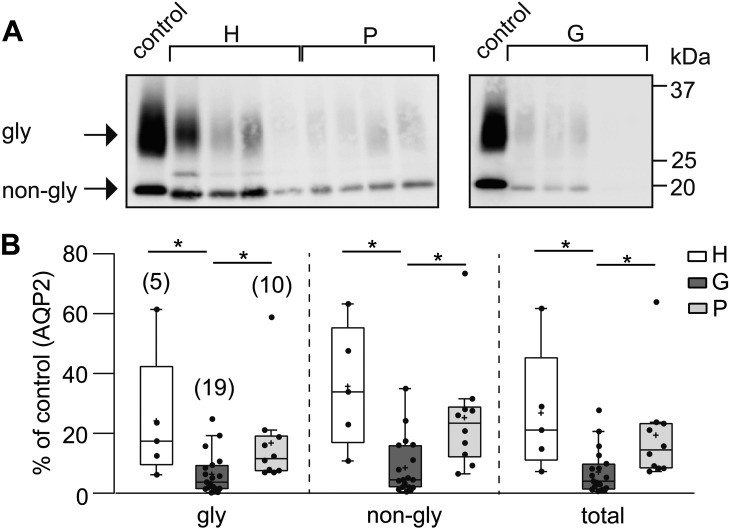
Fig. 1.
Comparison of aquaporin-2 (AQP2) levels in urinary extracellular vesicles (uEVs) between heifers (H), cows during gestation (G), and cows in the postpartum period (P). (A) Typical immunoblots of AQP2 in uEVs (uEV-AQP2) in the H, G, and P groups are shown. The upper and lower bands correspond to the glycosylated (gly) and non-glycosylated (non-gly) forms of AQP2, respectively. Control indicates the band for one constant control (see the MATERIALS AND METHODS section). (B) Quantitative summary of immunoblotting results. After normalization of the intensity of each band against the band intensity of the control, the data are shown as dot and box plots. Total indicates gly + non-gly AQP2. Numbers in parentheses indicate the number of animals examined. *P<0.05.

