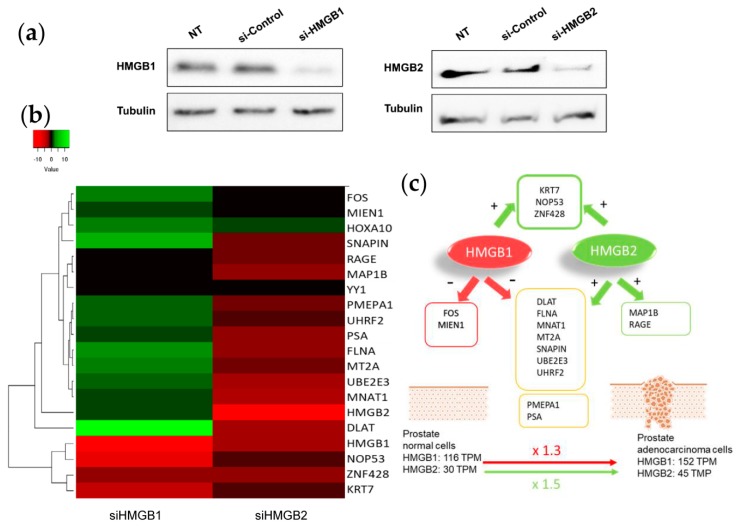
Figure 6.
HMGB1 and HMGB2 silencing: (a) Western Blot showing HMGB1 and HMGB2 silencing. Complete membranes provided as Supplementary Material, Image S2 (b) Heat map comparing the pattern of expression (siHMGB1/HMGB1 and siHMGB2/HMGB2). (c) Summary of regulatory effects of HMGB1 and HMGB2 on the selected genes.

