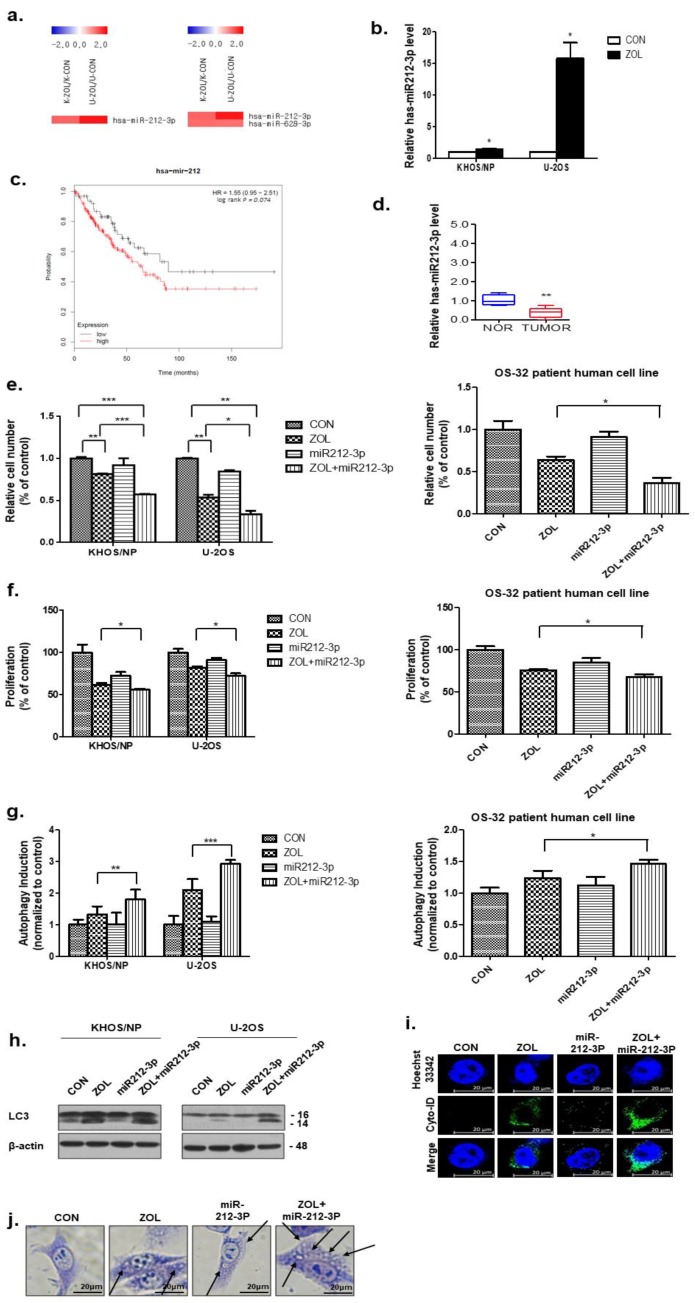
Figure 6.
miR-212-3p directly targets autophagy in zoledronic acid (ZOL)-treated osteosarcoma (OS) cells. (a) Expression analysis of miRNAs upregulated after ZOL treatment. (b) miR-212-3p levels were analyzed by qRT-PCR in OS cells treated with ZOL. * p < 0.05 (c) Kaplan–Meier survival curves for sarcoma patients based on miR-212-3p expression. The survival rate is shown; p < 0.05. (d) The relative expression of miR-212-3p in matched primary OS tissues and non-tumor tissues. (e) Cells were treated with ZOL or miR-212-3p for 48 h, and the proliferation rate was measured by cell counting; * p < 0.05, ** p < 0.01, *** p < 0.001. (f) The proliferation rate was detected by MTT assay at the same time point. * p < 0.05. (g) Two OS cell lines and patient-derived cells were treated with ZOL (80 μM) and miR-212-3p or a combination for 48 h. ZOL + miR-212-3p treatment resulted in an increase in the CYTO-ID® dye signal compared to that following either single treatment; * p < 0.05, ** p < 0.01, *** p < 0.001. (h) Immunoblotting of LC3 in lysates from KHOS/NP and U2OS cells. (i) ZOL + miR-212-3p treatment resulted in an increase in the CYTO-ID® dye signal in KHOS/NP cells after 48 h. (j) Cells were treated with ZOL or miR-212-3p for 48 h, stained with Giemsa (10% in PBS), washed, and photographed under an Eclipse Ts2R-FL microscope (magnification 40×). The black arrows point to vacuoles. A representative image from two independent experiments is shown.

