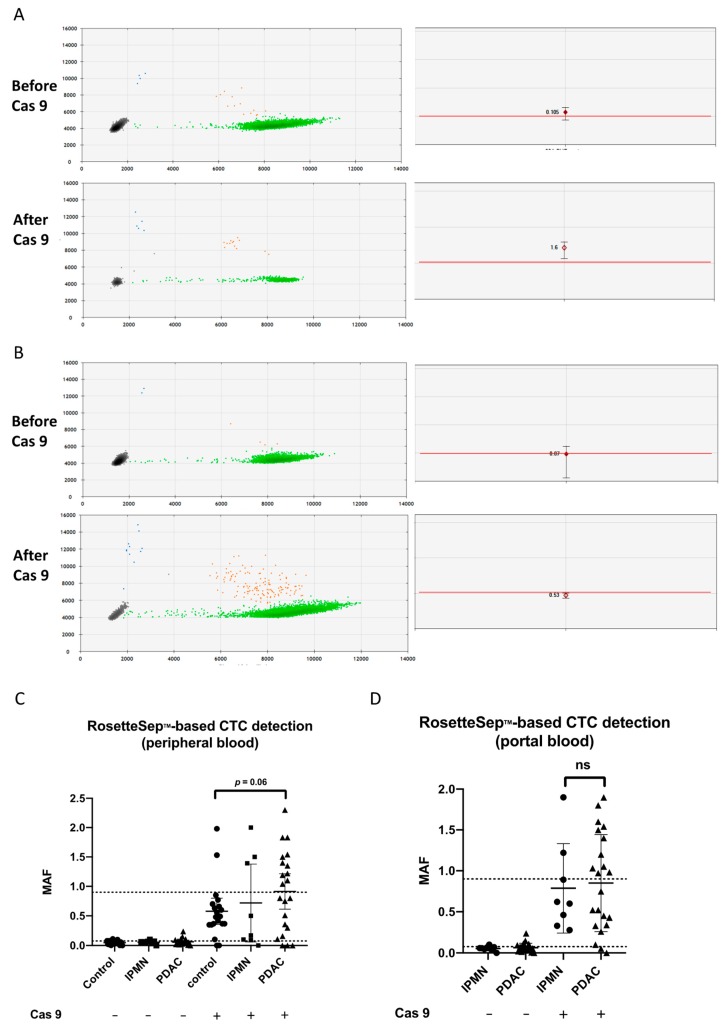
Figure 4.
The ddPCR results for KRAS detection after CTC enrichment. (A,B) Individual droplet PCR fluorescence results are plotted as two-dimensional dot plots (left). Grey dots correspond to empty droplets. Green dots correspond to droplets containing wild-type (WT) copies of KRAS. Blue dots correspond to droplets containing one mutant KRAS allele. Orange dots correspond to droplets containing WT (X-axis of the left panels corresponding to the HEX, hexachlorofluorescein succinimidyl ester fluorophore) and mutant alleles (Y-axis of the left panels corresponding to the FAM, 6-carboxyfluoresceine fluorophore). On the right panels, MAFs are shown for individual results, with the maximum and the minimum values of triplicates; the red lines indicate the positivity threshold. Patient #36 (A) became positive and patient #39 (B) was negative for KRAS mutation before and after Cas9. (C,D) MAF of KRAS mutation by ddPCR after RosetteSepTM CTC enrichment. Greater median MAF in CTC-enriched samples after CRISPR/Cas9 cut of the wild-type KRAS allele as compared to uncut DNA in (C) peripheral and (D) portal blood. Higher median MAFs in patients compared with the control group tended toward significance (p = 0.06 by Mann–Whitney test). MAF: mutant allele frequency.

