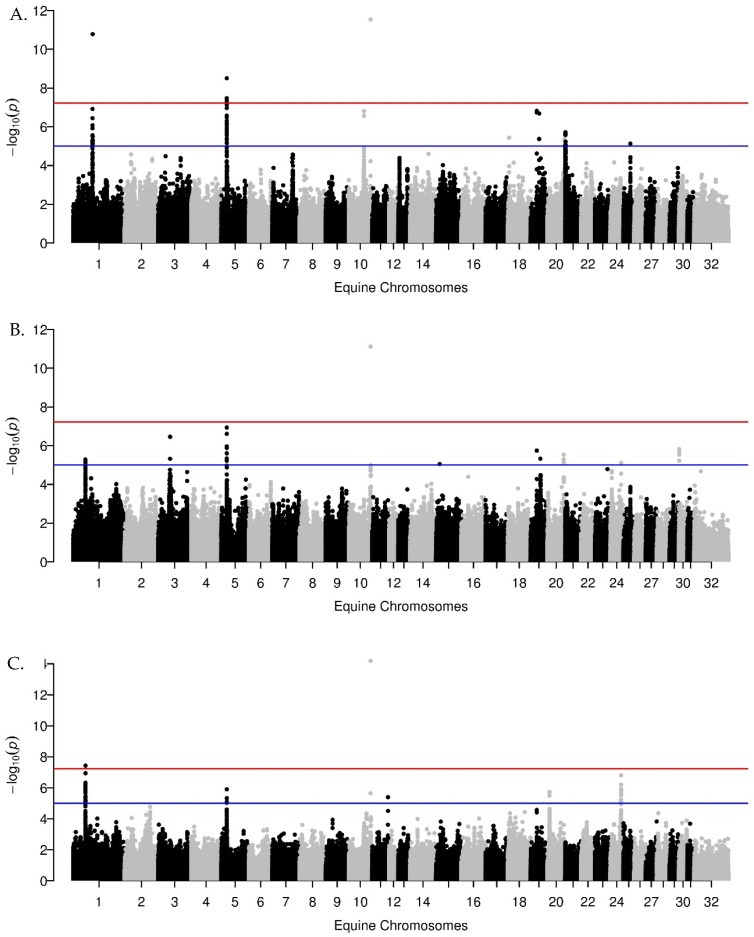
Figure A2.
Manhattan plots of the genome-wide association results for ACTH in (A) full Welsh pony cohort, (B) the section A, B, C and D Welsh ponies, and (C) the section A and B Welsh ponies. The equine chromosomes (ECA) are plotted on the x-axis and the −log10 of the p-value is plotted on the y-axis. The blue line indicates the suggestive threshold (1.0 × 10−05) and the red line represents the genome-wide significant threshold (5.9 × 10−08). In all three GWA, the same region on ECA5 exceeds the suggestive threshold but is only identified as an ROI in the full cohort (A).

