Figure 3.
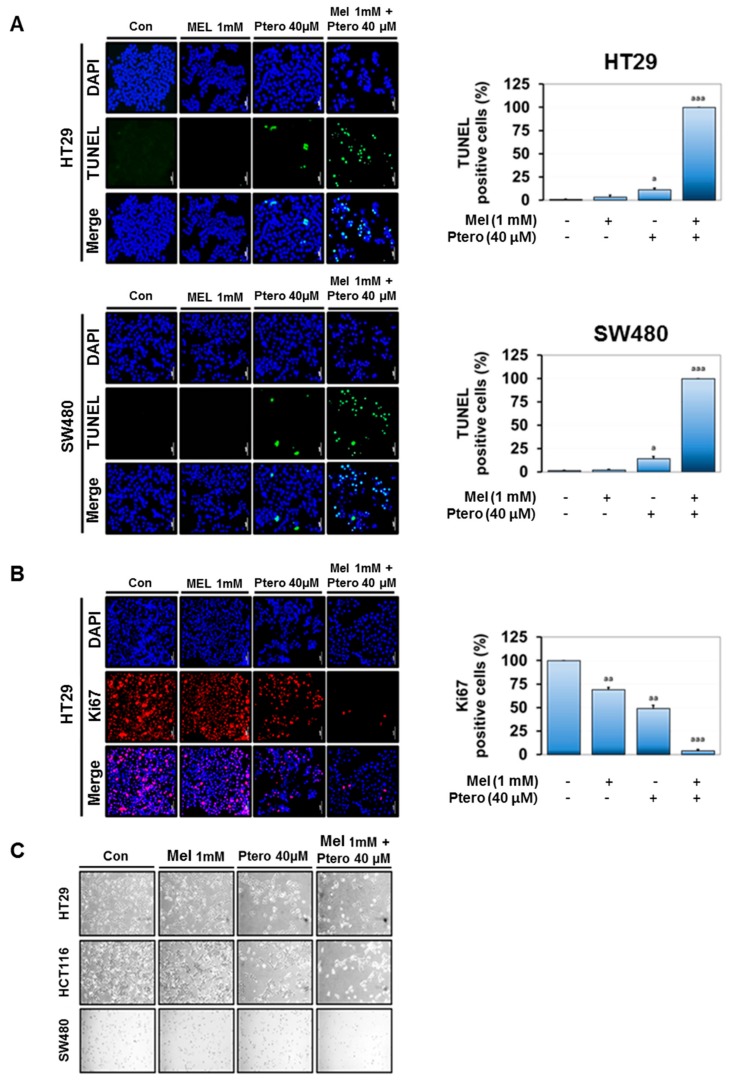
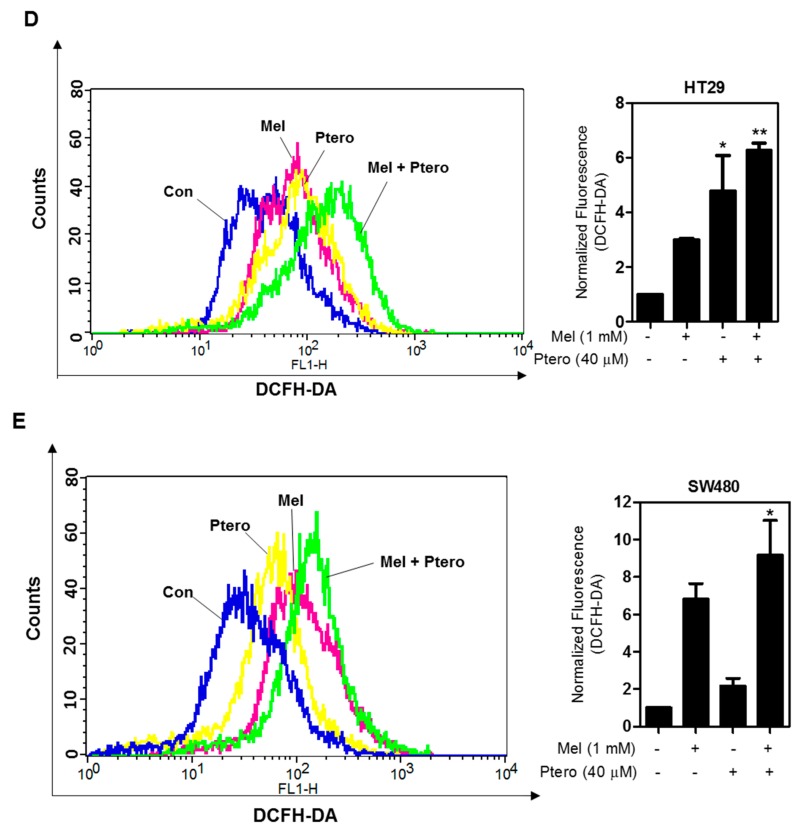
Effect of MLT+Ptero on TUNEL-positive cells, Ki67 expression, and reactive oxygen species (ROS) production in colon cancer cells. (A) Effect of MLT+Ptero on TUNEL-positive cells in HT29 and SW480 cells. HT29 and SW480 cells were exposed to MLT (1 mM) and/or Ptero (40 µM) for TUNEL staining. The fluorescent signals from fragmented DNA (green) and 4′,6-diamidino-2-phenylindole. (DAPI) (blue) were visualized and photographed by a FLUOVIEW FV10i confocal microscopy. Magnification bar = 50 µm. Bar graphs represent quantification of TUNEL-positive cells (%). Data represent means ± SEM of triplicate samples. * p < 0.05, *** p < 0.001 vs. untreated control. (B) Effect of MLT+Ptero on Ki67 expression in HT29 cells. Immunofluorescence staining of proliferation marker Ki67 in HT29 cells. Nuclei were stained by DAPI (blue) stain and anti-rabbit Alexa Fluor 546 (red). ** p < 0.01, *** p < 0.001 vs. untreated control by one-way ANOVA test. (C) Effect of MLT+Ptero on apoptotic morphological changes in HT29, SW480, and HCT116 cells. Following exposure to MLT and/or Ptero in three colon cancer cells for 24 h, apoptotic morphology of the cells was observed in the cells under phase contrast microscope. (D,E) Effect of MLT+Ptero on ROS production in HT29 or SW480 cells. HT29 or SW480 cells were treated with MLT (1 mM) and/or Ptero (40 μM) for 24 h and then 10 μM Dichloro-dihydro-fluorescein diacetate (DCFH-DA) for 30 min at 37 °C. Fluorescence intensity was measured by Dichloro-dihydro-fluorescein diacetate (FACS) Calibur. Bar graphs showed quantification of ROS generation. Data represent means ± SD. * p < 0.05 versus untreated control (n = 2, one-way ANOVA, Tukey’s test).


