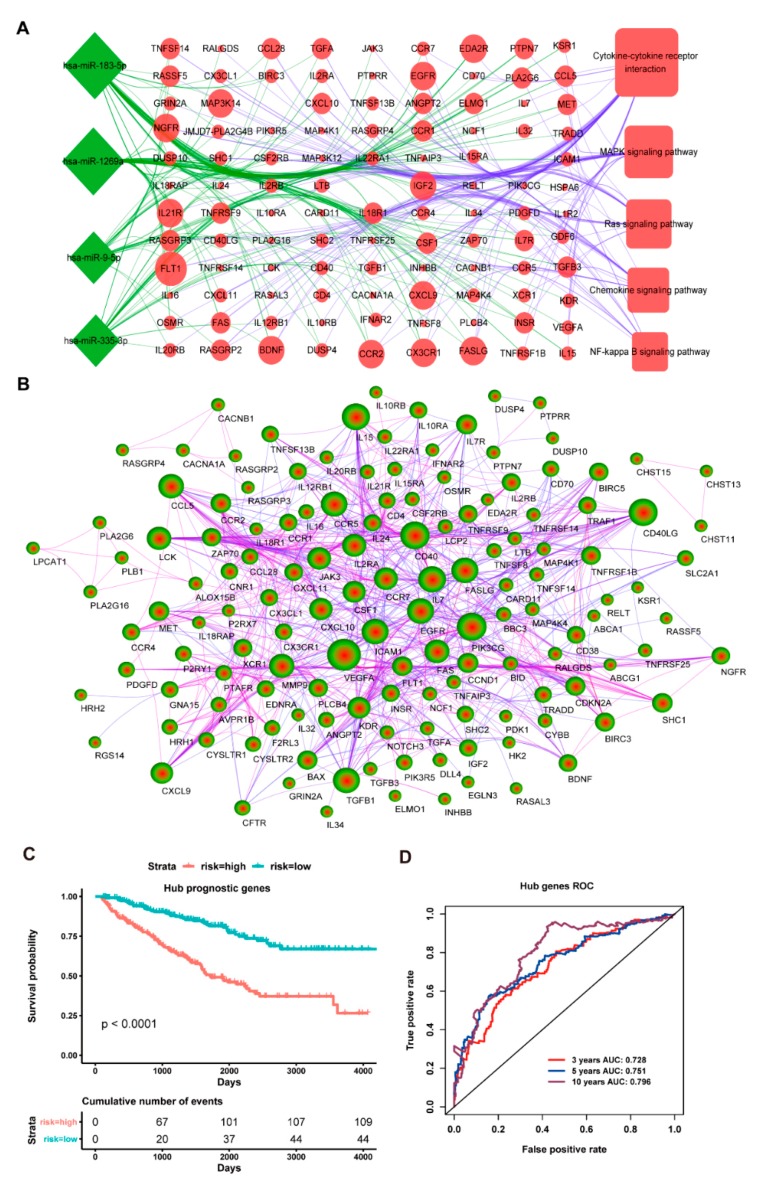
Figure 4.
The cancer signaling pathway and protein network analysis of these up-regulated targets and the prognostic model of the ten-hub gene signature. (A): Target genes of four down-regulated miRNAs involve in the network map of cancer-related signaling pathways. The green represents the down-regulated expression and the red represents up-regulated expression; (B): Target protein interaction network of four down-regulated miRNAs. The blue line means low credibility and the purple line means high credibility; (C): Overall survival curves for high-risk and low-risk groups based on the ten-hub gene model; and, (D): ROC curves for high-risk and low-risk based on the ten-hub gene model.

