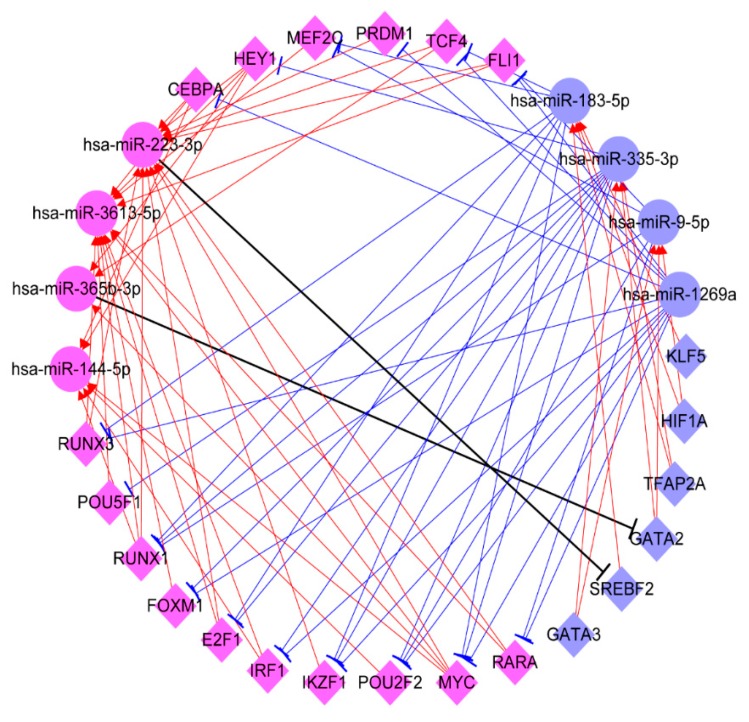
Figure 7.
The interplay network between twenty-two transcription factors and eight miRNAs. The circle represents the miRNA and the diamond represents the transcription factor. The blue represents a down-regulation expression and the purple represents an up-regulation expression. The sharp arrow represents activation and the flat arrow represents inhibition.

