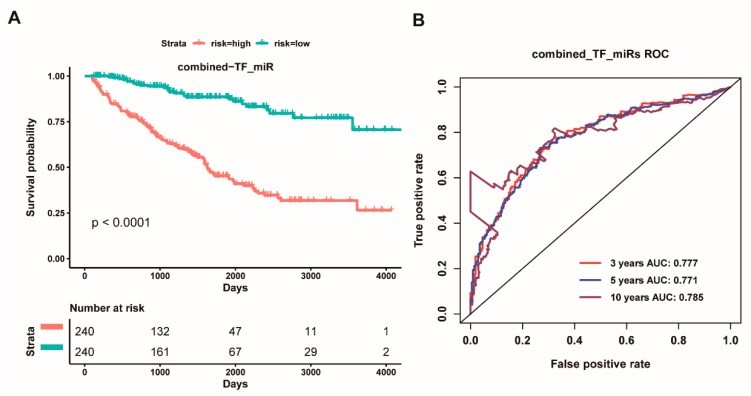
Figure 9.
Kaplan Meier survival and ROC curves based on the risk score of the combined five transcription factors and six miRNAs as a signature. (A): Overall survival curves for high-risk and low-risk groups based on the prognostic model of an eleven-gene signature; and, (B): ROC curves for high and low risk from the prognostic model of an eleven-gene signature.

