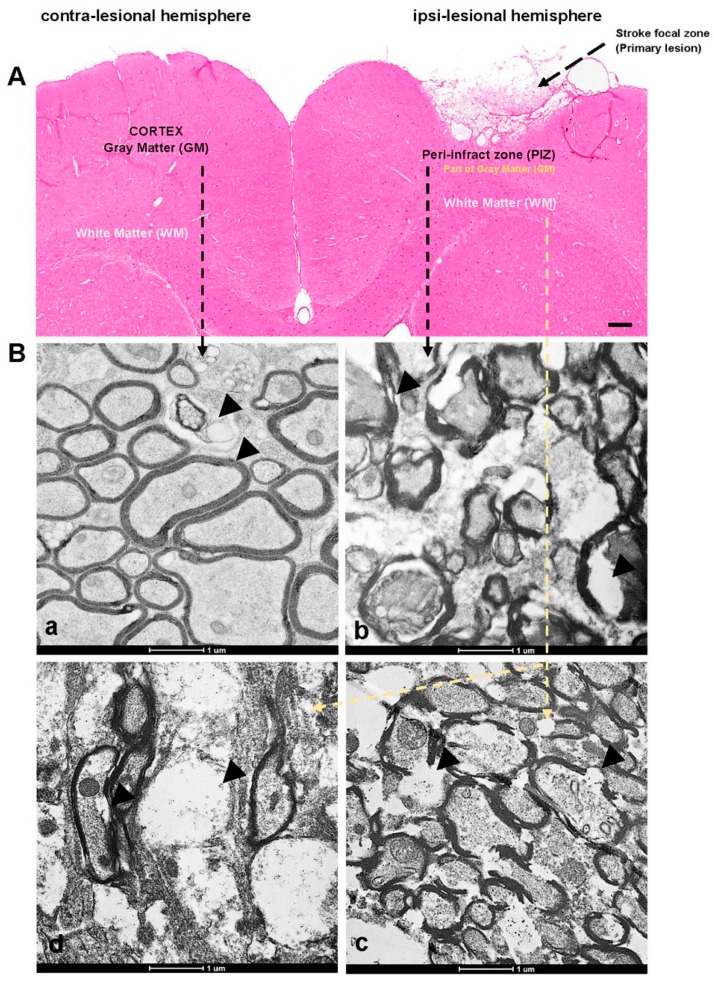
Figure 1.
The hematoxylin and eosin (H&E) staining and transmission electron microscopy (TEM) images. (A) Contra-lesional and Ipsi-lesional hemispheres of nine weeks stroke brain tissues showing the regions of interest—peri-infract zone (PIZ) and white matter (WM). (Ba) Representative TEM images of contra-lesional cortex (unaffected neurons), whereas (Bb) representing ipsi-lesional PIZ (affected side) and (Bc–d) representing ipsi-lesional WM showing the ultrastructural changes—axonal shearing, formation of vacuoles and swelling marked with black arrows on the images. Scale bar = 100 µm for H&E and 1 µm for TEM.

