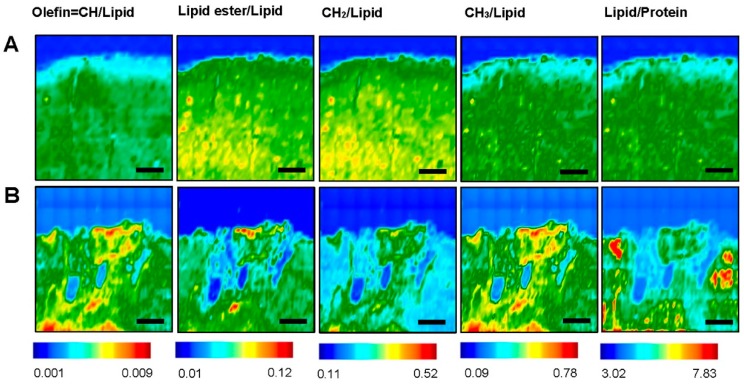
Figure 3.
Fourier Transform Infrared (FTIR) images of different lipid components—Olefin=CH/Lipid, Lipid ester/Lipid, CH2/Lipid, CH3/Lipid and Lipid/Protein at (A) Contra-lesional and (B) Ipsi-lesional of nine weeks post stroke brain tissue. The color bars showing the intensity of the biochemical components—red as maximum and blue as minimum. Scale bar = 100 µm.

