Figure 4.
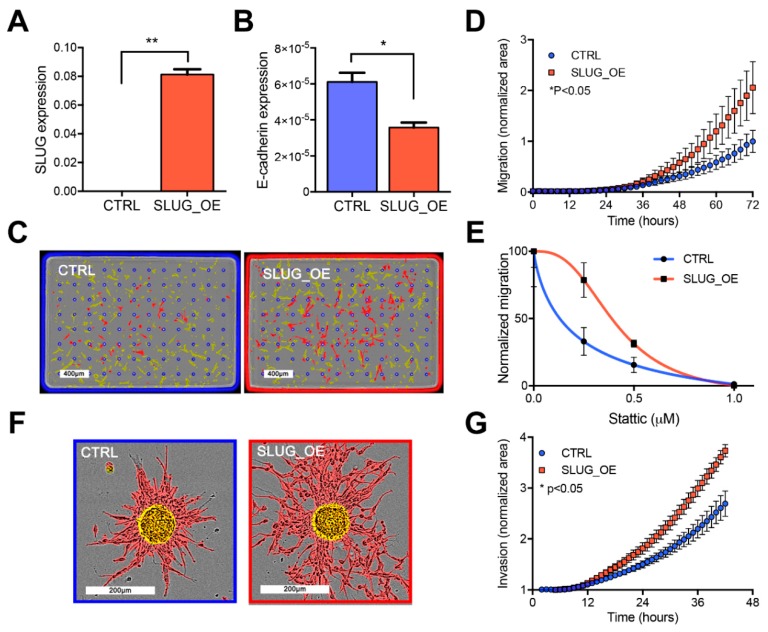
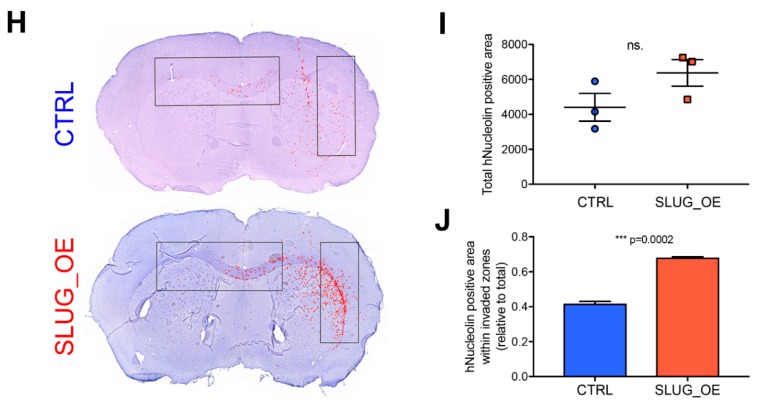
SLUG promotes migration and invasion both in vitro and in vivo (see also Figure S6). Bar graphs representing (A) SLUG and (B) E-cadherin expression in BT69 control (CTRL) and overexpressing SLUG (SLUG_OE) as measured by RT-PCR (* p < 0.05; ** p < 0.01). (C) Representative images of cells on the upper side of the membrane (highlighted in yellow) and cells that have migrated to the bottom side (highlighted in red) and (D) quantified migration of CTRL and SLUG_OE cells. (E) Graph of STAT3 inhibition (STATTIC) impact on migration of BT69 CTRL and SLUG_OE. (F) Representative overlaid images of spheres embedded in collagen at T0 (highlighted in yellow) and pictures of invaded cells at end point (highlighted in red). (G) Graphical representation of the quantified invasion of BT69 CTRL and SLUG_OE cells in vitro (area of invaded cells (highlighted in red) was normalized to the area of the imbedded spheres at T0 (highlighted in yellow). (H) Representative pictures of the invasive behavior of BT69 CTRL and SLUG_OE cells in a corpus callosum implantation assay. hNucl positive cells were overlaid with large red dots on the high resolution images to illustrate the tumor cell distribution throughout the brain at endpoint. (I) Total hNucl positive area throughout the brain sections. (J) Graphical representation of the hNucl positive area in invaded zones (represented as rectangles) normalized to total hNucl positive area. Error bars represent SEM (A–J).


