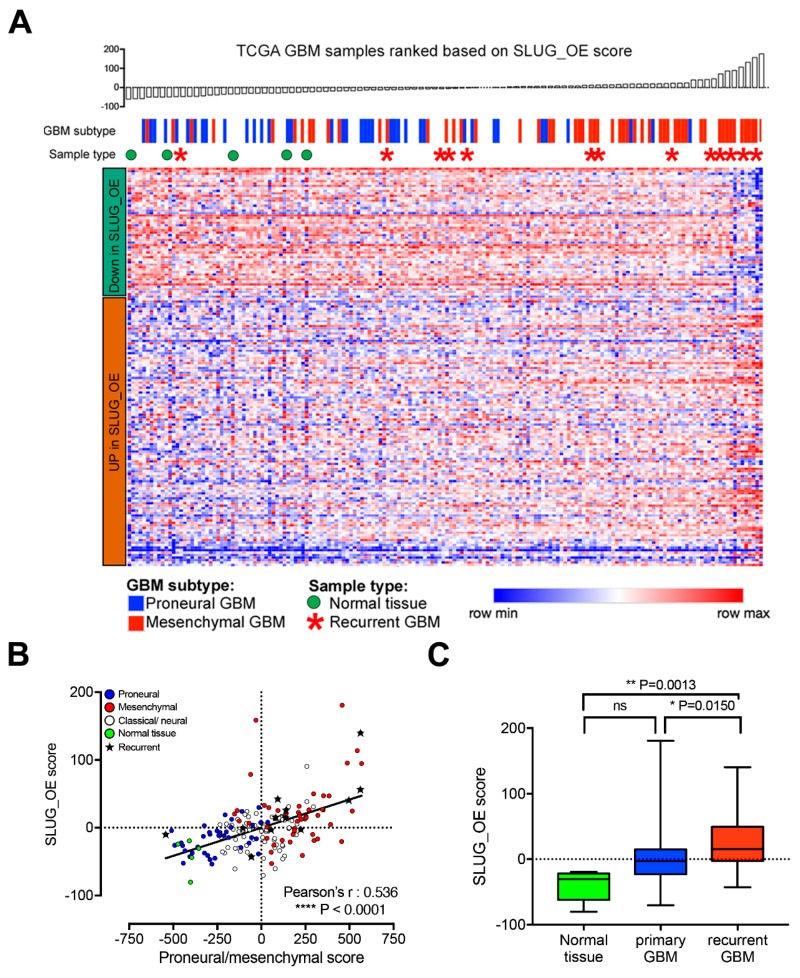
Figure 8.
SLUG-induced transcriptional changes are associated with recurrence in GBM patients. (A) Heatmap representing the expression of the 180 genes of the SLUG_OE score in 172 TCGA GBM samples. Samples were ranked according to the SLUG_OE score. (B) Scatter plot showing correlation between the SLUG_OE score and the proneural to mesenchymal score and association with recurrent samples (annotated with a star). (C) Box and whiskers plot (min to max) showing increased SLUG_OE score in recurrent compared primary GBMs and normal brain tissue samples.

