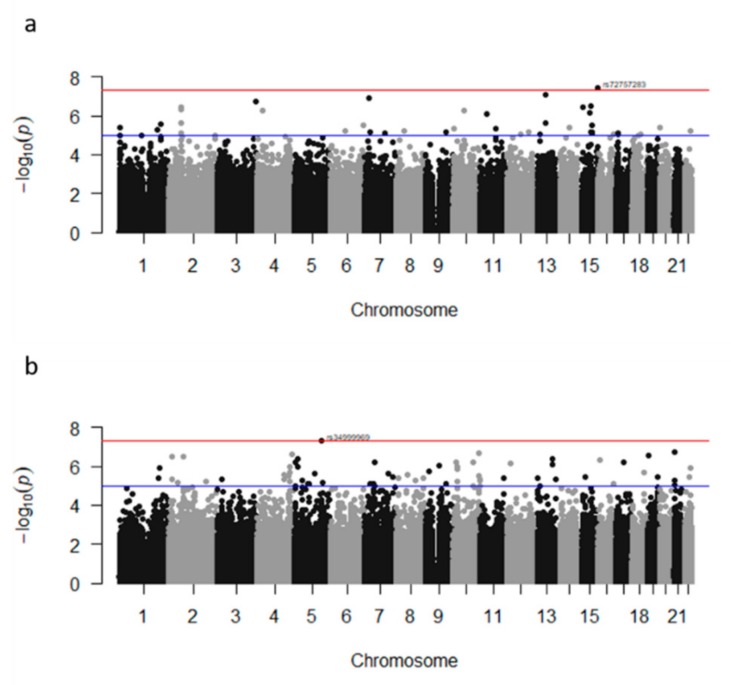
Figure 1.
Manhattan plot of results of the genome-wide association study before imputation of (a) body mass index; and (b) percent body fat in children from Mexico City. Chromosomes are shown on the x-axis, and the −log10 of the p-value on the y-axis. The red line represents the genome-wide significance cut off of 5.0 × 10⁻⁸. The blue line shows false discovery rate significance cut off.

