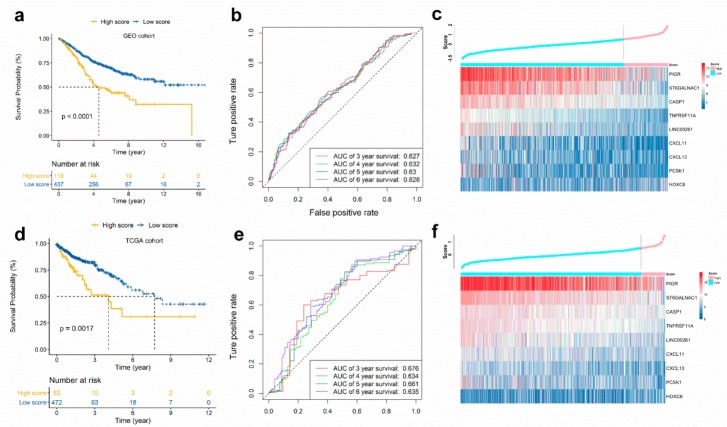
Figure 3.
Validation of immunoscore model. Patients were stratified by low or high immunoscore (low and high score). Kaplan-Meier curves, heatmap and time-dependent ROC curve in GEO cohort (a–c) and TCGA cohort (d–f). (a,d) Kaplan-Meier curves show that OS in the low score group was significantly higher than in the high score group. (b,e) Time-dependent ROC curve analysis of the immunoscore. (c,f) Relationship between the immunoscore and the heatmap for the expression of the selected prognostic genes.

