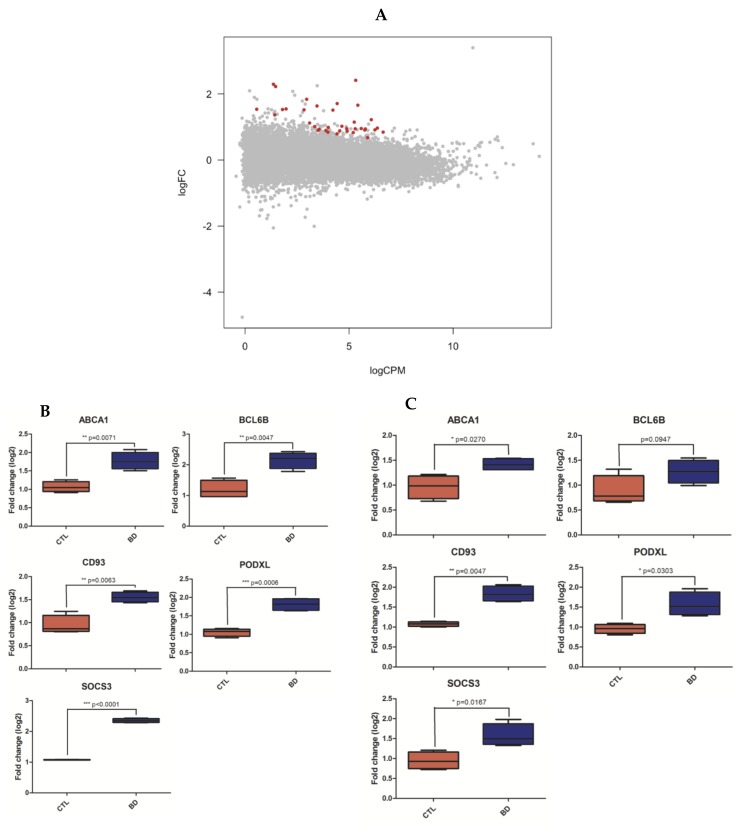
Figure 1.
Differentially expressed genes analyses. Plot showing the 36 significant differentially expressed genes (DEGs) at FDR < 0.1 in subjects with BPD (blue) versus healthy controls (red, A). Validation (B) and replication (C) of RNAseq gene expression analysis by RT-qPCR. RNA level differences were calculated by unpaired Welch t-test (* p < 0.05, ** p < 0.01, *** p < 0.005). All 5 DEGs were successfully validated by RT-PCR and had significant increased expression levels in BPD patients compared to controls (B). Four out of five DEGs were successfully replicated and had increased expression levels in BPD patients compared to controls; only BCL6B did not replicate significantly, although its expression level aligned with the sequencing data (C).

