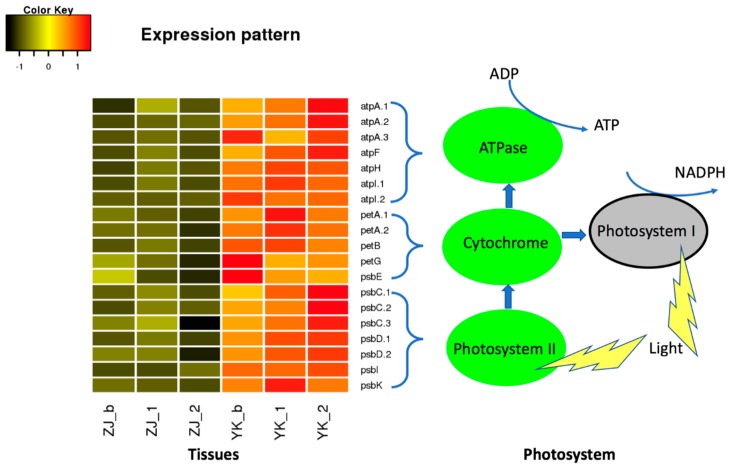
Figure 7.
Comparison of expression levels of DEGs in photosystem in tea cultivar ZJ and YK. Image shows the differential expression levels of genes involved in the photosystem components II (green) in ZJ and YK. Suffix _b, _1 and _2 represent the bud, the 1st leaf immediately next to the bud and the 2nd leaf immediately next to the 1st leaf. The heatmap shows the Z-score of gene expression after the log2 (FPKM) transformation.

