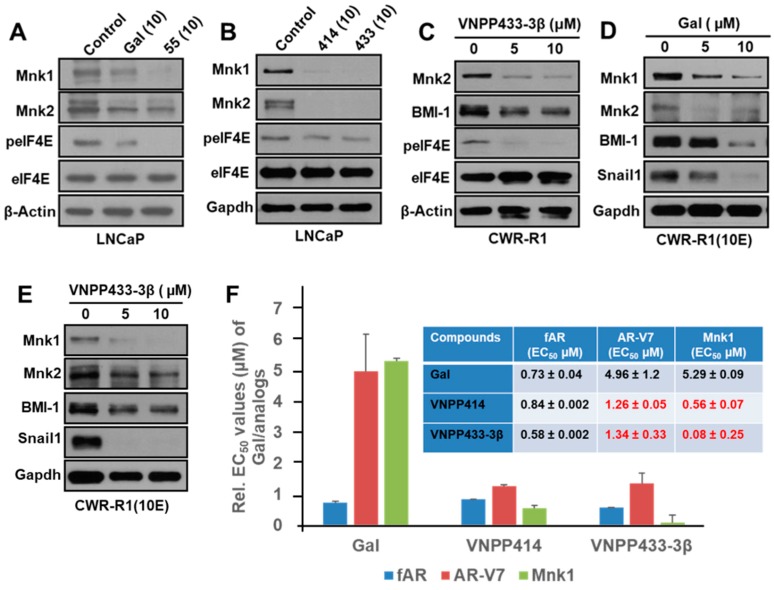
Figure 4.
Impact of Gal and NGGAs on AR/AR-V7 and Mnk1/2-eIF4E signaling pathways. (A) Western blot showing the effects of Gal and VNPT55 (55) on Mnk1, Mnk2, and peIF4E. (B) Western blot showing the effects of VNPP414 (414) and VNPP433-3β (433)) on Mnk1, Mnk2, and peIF4E. (C) Western blot showing dose-dependent effect of VNPP433-3β (433) on Mnk2, BMI-1, and peIF4E in CWR-R1 cells. (D) Western blot showing dose-dependent effect of Gal on Mnk1, Mnk2, BMI-1, and Snail1 in drug-resistant CWR-R1(10E) cells. (E) Western blot showing dose-dependent effect of VNPP433-3β (433) on Mnk1, Mnk2, BMI-1, and Snail1 in drug-resistant CWR-R1(10E) cells. (F) EC50 values (for fAR, ARV-7 and Mnk1) for compounds determined from dose–response curves upon compound treatments (0–7.5 µM) of CWR22Rv1 cells for 72 h followed by western blot analysis of cells lysates. Note: the numbers in parentheses in Figure 4B are concentrations of the agents in µM.

