Figure 2.
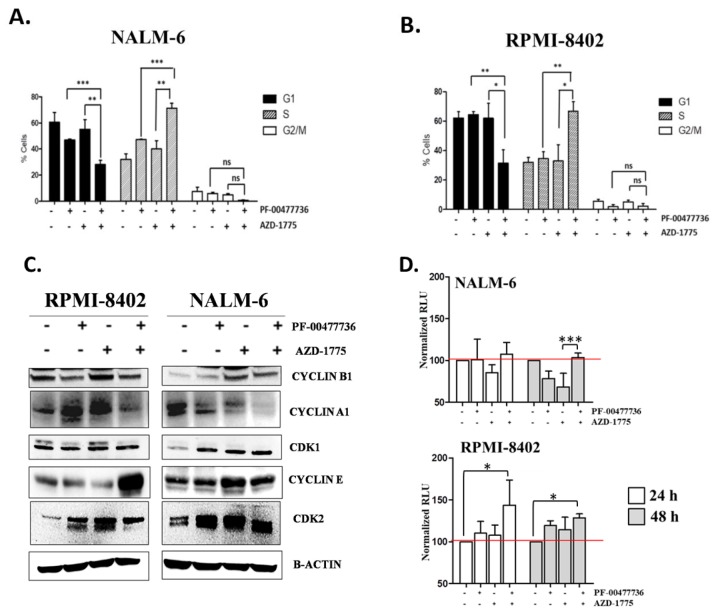
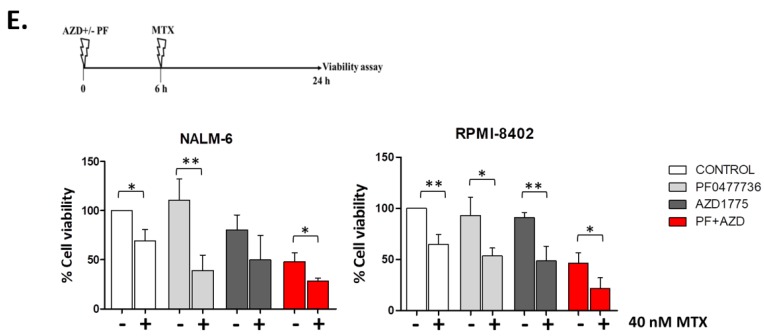
PF-00477736 in combination with AZD-1775 causes early S-phase arrest. (A) Cell cycle analyses of NALM-6 cell lines treated simultaneously with subtoxic concentration AZD-1775 (185 nM) and PF-00477736 (250 nM) for 24 h. The histograms show the percentage of cells in a specific cell cycle phase. (B) Cell cycle analyses of RPMI-8402 cell lines treated simultaneously with subtoxic concentrations of AZD-1775 (185nM) and PF-00477736 (25 nM) for 24 h. The histograms show the percentage of cells in a specific cell cycle phase. (C) Western Blot analyses of RPMI-8402 and NALM-6 cell lines treated for 24 h with AZD-1775 (185 nM) and PF-00477736 (25 and 250 nM respectively). β-actin was used for loading normalization. For relative quantification of each protein see Figure S1C and for whole western blot images see Figure S4. (D) The graph represents the normalized RLU (relative light unit) of NALM-6 and RPMI-8402 treated with AZD-1775 (185 nM) and PF-00477736 (25 and 250 nM respectively) for 24 and 48 h. the experiments were performed in triplicates. (E) Viability analysis of NALM-6 and RPMI-8402 cell lines treated with AZD-1775 (185 nM) and PF-00477736 (250 and 25 nM, respectively) for 6 h and then with MTX (40 nM) for 18 h. Above the histograms is schematically represented the experimental procedure for the drug combination studies. The flash lighting points when the drugs were added to the cell culture. In the figures statistical significance was represented as asterisks and in detail: p < 0.05 one asterisk (*); p < 0.01 two asterisks (**); p < 0.001 three asterisks (***).


