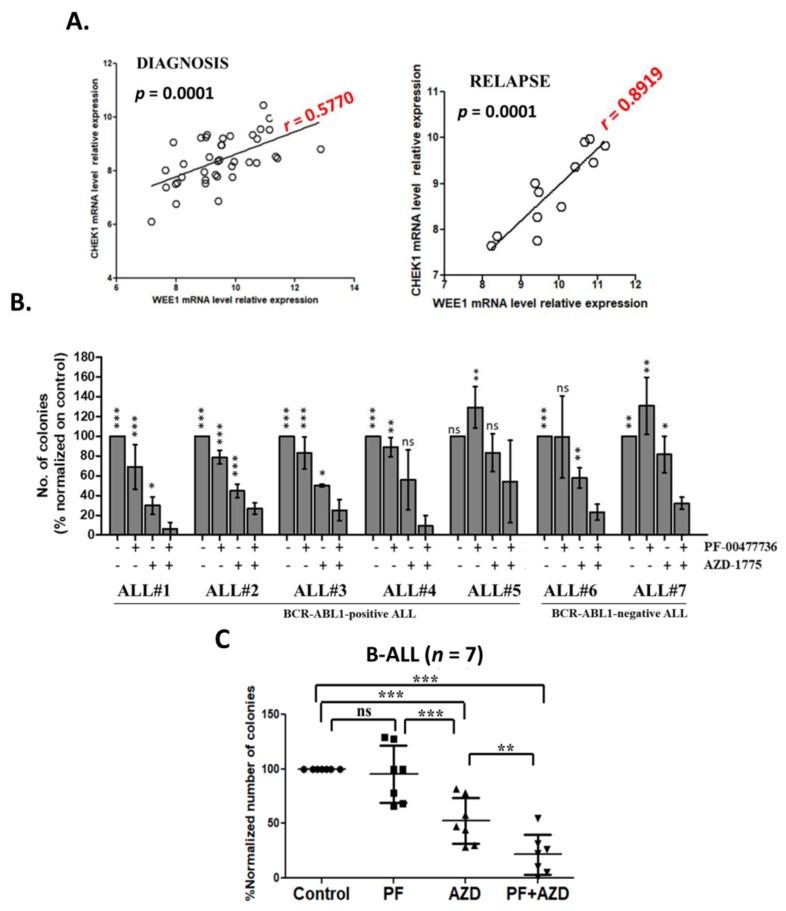
Figure 4.
The inhibition of CHK1, CHK2 e WEE1 compromises primary leukemic B-ALL clonogenic capacity. (A) Dot plot showing the Pearson correlation (r value) of Wee1 and Chek1 relative mRNA level in primary leukemic ALL samples at diagnosis (n = 39) and at relapse (n = 14). On the top of each dot plot is reported the statistical significance of the analysis and on the linear regression is reported in red the Pearson correlation value (r). (B) Clonogenic assays of primary leukemic cells isolated from the bone marrow of adult B-ALL patients (n = 7). The columns represent the normalized number of colonies in the treated samples in relationship to the control. The asterisks in the graph represent how the effect of the combined treatment in the reduction of the number of colonies is significantly different from the single treatments and from the un-treated control. (C) Scatter plot representing the mean of 7 independent experiments. In the graph AZD-1775 in combination with PF-00477736 is named AZD + PF. In the figures statistical significance was represented as asterisks and in detail: p < 0.05 one asterisk (*); p < 0.01 two asterisks (**); p < 0.001 three asterisks (***).

