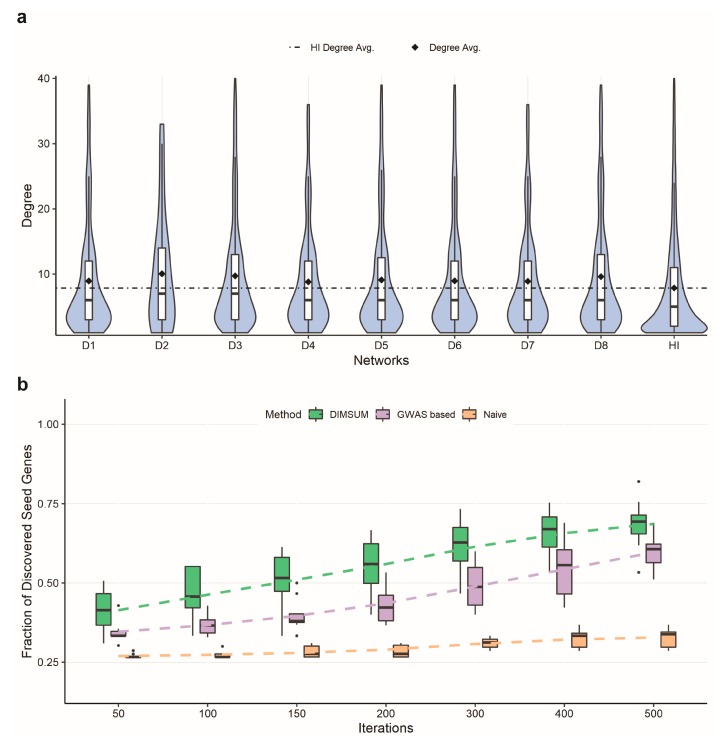
Figure 2.
Annotated networks and comparison of DIMSUM against a naïve and a GWAS based network propagation procedures. (a) The first eight violin plots represent the node degree distributions of disruptively mutated genes for eight complex diseases; the last violin plot is the node degree distribution of all genes in the human interactome (HI); the avg. degree of the disrupted genes is much greater than the avg. degree of HI, showing that highly connected genes are disrupted. (b) Comparison of the seed genes discovered when randomly selecting 25% of the seed gene pool as seeds. Each box plot represents the fraction of discovered seed genes across all eight diseases from DIMSUM, a GWAS based and a naïve network propagation at different iterations. DIMSUM performs significantly better than the other two approaches at the initial 50 iterations and improves drastically with increasing iterations.

