Figure 1.
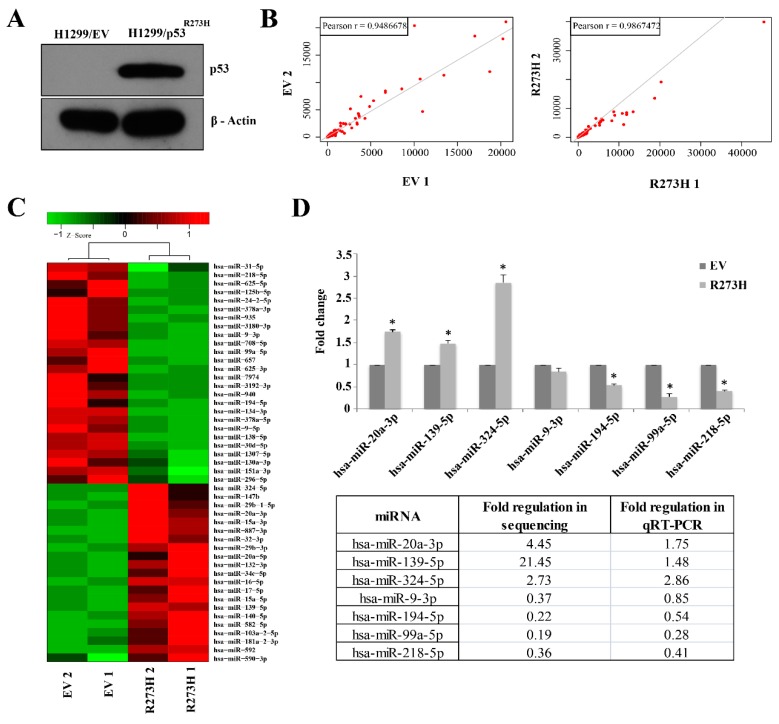
miRNA expression profiling in H1299 cells expressing mutant p53R273H using small RNA sequencing. (A) Immunoblot showing mutant p53R273H level in H1299/ mutant p53R273H stable cells. (B) Scatter plots showing a correlation of normalized read counts between biological replicates of individual samples. (C) Heat map showing normalized read counts of miRNAs differentially expressed (p-value ≤ 0.05) between H1299/mutant p53R273H and H1299/EV cells. Hierarchical clustering of samples is shown. Color bar indicates Z- scores of normalized read counts. Red color indicates high expression, green color indicates low expression. (D) Validation of the selected differentially expressed miRNAs in H1299/mutant p53R273H cells using qRT-PCR. Bar graphs represent mean ± s.d.; n≥ 2; two-tailed Student’s t-test: * p < 0.05. A relative comparison of qRT-PCR data with the deep sequencing results is shown.

