Figure 9.
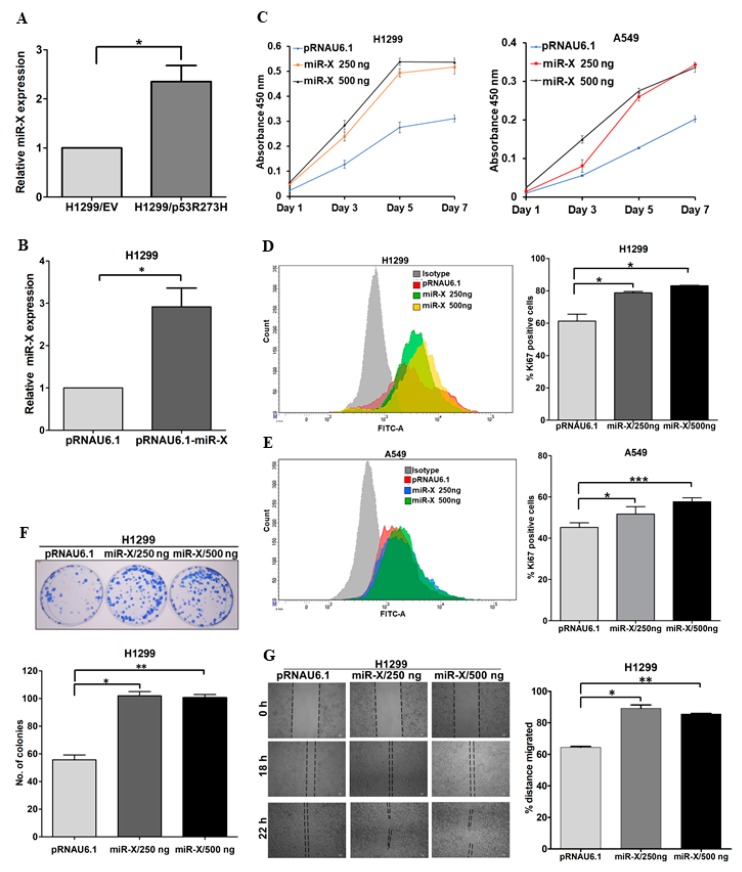
miR-X promotes oncogenic properties in lung cancer cells. (A) QRT-PCR data showing relative expression levels of miR-X in H1299/EV and H1299/mutant p53R273H stable cell lines (B) QRT-PCR data showing ectopic expression of miR-X in H1299 cells transfected with pRNAU6.1-miR-X. H1299 cells were transfected with either empty pRNAU6.1 vector or with 250 ng of pRNAU6.1-miR-X. Forty eight hours post-transfection relative miR-X expression was evaluated using qRT-PCR. (C) Bar graphs showing relative proliferation of H1299 (left panel) and A549 (right panel) cells upon ectopic expression of miR-X as measured by WST-1 cell proliferation assay. Cells were transfected with either empty vector or miR-X expression plasmid and 16 h post-transfection WST-1 assay was performed for the day 1 and for the days indicated. Data represents average absorbance values at 450 nm of three independent experiments. (D,E) (Left panels) Histogram showing mean fluorescent intensities of empty vector and miR-X transfected H1299 (D) and A549 (E) cells stained with anti-Ki-67 antibody as measured by FACS analyses. (Right panels) Bar graphs showing relative percentages of Ki-67 positive H1299 (D) and A549 (E) cells transfected with control empty vector or with miR-X expression plasmid. (F) (Upper panel) Representative images of colonies formed by H1299 cells upon miR-X overexpression in clonogenic assay. (Lower panel) Quantification of the data that were obtained from the clonogenic assay. (G) (Left panel) Representative images of wound healing assay performed in H1299 cells transfected with either empty vector or miR-X expression plasmid. Images were captured at 0 h, 18 h, and 22 h after the scratch was introduced. (Right panel) Bar graph showing relative percentage of distance covered by the cells through 18 h post-scratch. Data represent mean ± s.d.; n = 3; two-tailed Student’s t-test: * p <0.05, ** p <0.01, *** p <0.001.

