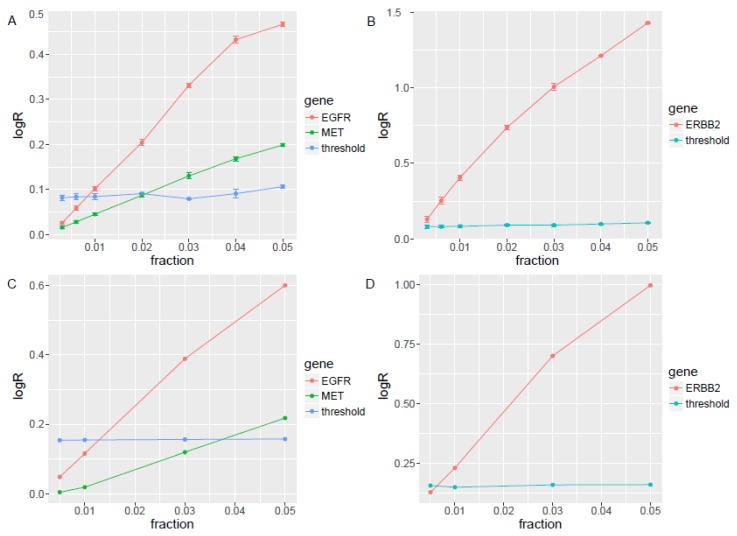
Figure 2.
The EGFR, MET, and ERBB2 limits of detection (LODs) in simulated samples and in vitro spike-in samples. (A) In silico simulation of NCI-H1573 cell line data with EGFR, and MET amplification into three sets of four normal cfDNA samples sequenced with the same panel in a series of 5%, 4%, 3%, 2%, 1%, 0.6%, and 0.3% to reach a sequencing depth of 10,000x to define the LOD for EGFR and MET. (B) In silico simulation of HCC1954 cell line data with ERBB2 amplification into three sets of four normal cfDNA samples sequenced with the same panel in a series of 5%, 4%, 3%, 2%, 1%, 0.6%, and 0.3% to reach a sequencing depth of 10,000x to define the LOD for ERBB2. (C) In vitro experiments dilution NCI-H1573 cell line’ cfDNA described above with another set of four normal cfDNAs to tumor fractions of 5%, 3%, 1%, and 0.5% by in vitro experiments to re-determine the LOD for EGFR and MET. (D) In vitro experiments dilution HCC1954 cell line’ cfDNA described above with another set of four normal cfDNAs to tumor fractions of 5%, 3%, 1%, and 0.5% by in vitro experiments to re-determine the LOD for ERBB2.

