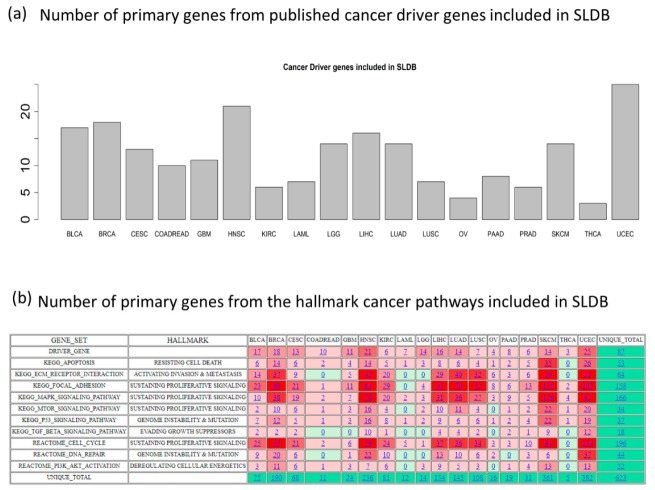
Figure 1.
General schema of SL-BioDP: (a) The bar-chart shows the number of cancer driver genes in 18 cancer types included as primary genes in SL-BioDP; (b) the heatmap shows the number of genes from each of the 10 hallmark cancer pathways included as primary genes in SL-BioDP for each of the 18 cancer types. The color coding is based on the frequency of the number of genes from a pathway in each cancer (red: more number of genes, green: less number of genes).

