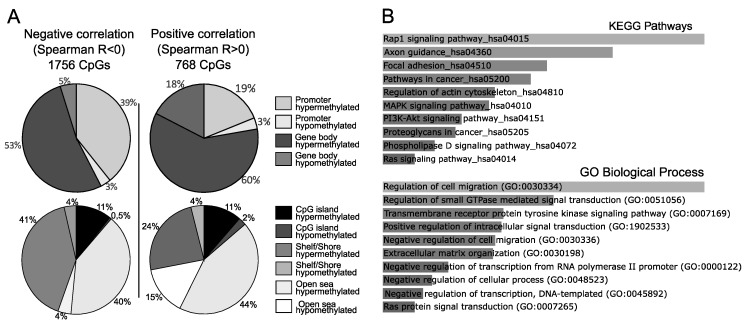
Figure 2.
Results of correlation analysis between the methylation level of aberrantly methylated CpGs and the expression of the associated genes. (A) Distribution of aberrantly methylated CpGs for which DNA methylation was correlated with the expression of the associated gene in NFPA samples. (B) Top Kyoto Encyclopedia of Genes and Genomes (KEGG) pathways and Gene Ontology (GO) biological processes that are enriched for genes which expression is correlated with DNA methylation levels in NFPAs.

