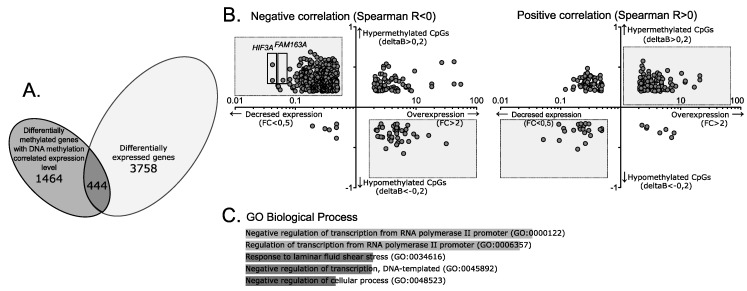
Figure 3.
The role of CpG methylation in the expression of genes differentially expressed in gonadotroph NFPAs. (A) Overlap between genes for which expression level was correlated with aberrant CpG methylation and genes differentially expressed in gonadotroph NFPAs and normal pituitary sections. (B) Analysis of the direction of the DNA methylation difference and the direction of expression change of genes associated with CpGs with negative and positive methylation/expression correlations. Each dot represents a particular CpG site. The difference in the DNA methylation level, where delta β > 0 denotes hypermethylation and delta β < 0 denotes hypomethylation, is presented on the y-axis. Fold change in gene expression is presented on the x-axis. CpGs with a methylation difference and a sign of methylation/expression correlation concordant with the direction of the gene expression change are shown in gray boxes. (C) The top five Gene Ontology (GO) processes enriched for differentially expressed genes with expression levels correlated with methylation levels of the annotated differentially methylated CpGs.

