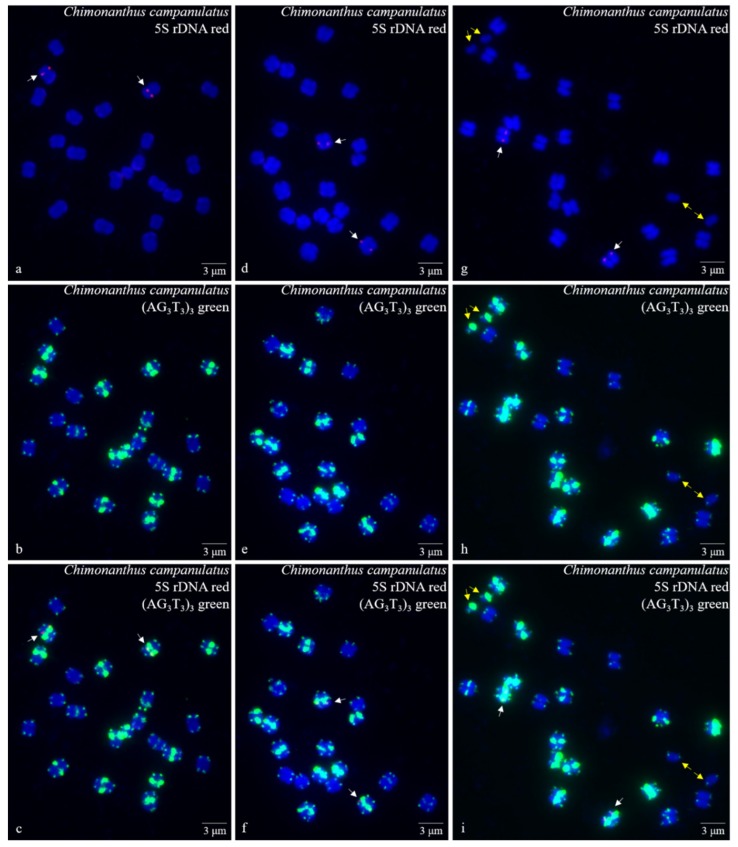
Figure 4.
Mitotic metaphase (final stage in Figure 4a–f, end of metaphase to beginning of anaphase in Figure 4g–i) chromosomes of Chimonanthus campanulatus after FISH. Three spreads are presented in Figure 4a–c, Figure 4d–f, and Figure 4g–i. The probe oligo–5S rDNA result with chromosomes visualized by TAMRA (red, white arrows) is shown in Figure 4a,c,d,f,g,i, whereas the probe oligo–(AG3T3)3 result with chromosomes visualized by FAM (green) is shown in Figure 4b,c,e,f,h,i. Two chromosomes have split into four chromosomes in Figure 4g–i (yellow arrows), and 20 chromosomes are preparing to split, which shows that this spread was at the end of metaphase to beginning of anaphase. Chromosomes were counterstained by DAPI (blue) in all images. Scale bar = 3 μM.

