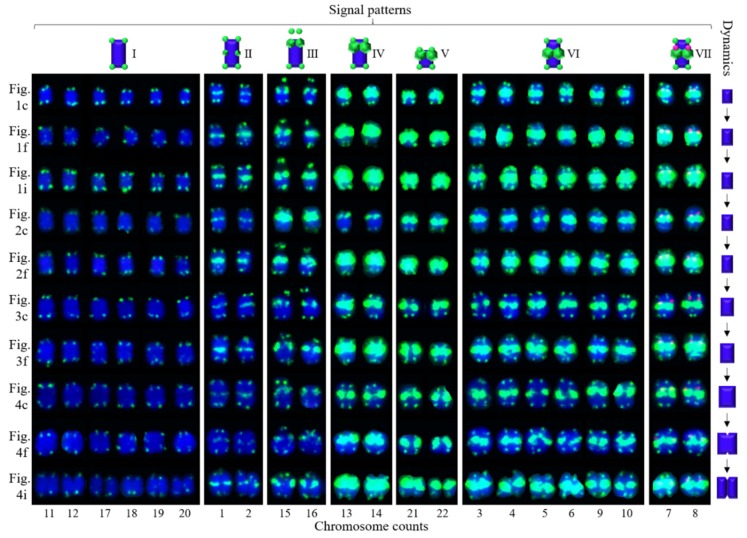
Figure 6.
Physical map of Chimonanthus campanulatus. Each chromosome was isolated from Figure 5. The left indicates the origins of each line of chromosomes. The right metaphase dynamic ideograms were constructed based on the metaphase dynamics of chromosomes shown on the left. The signal pattern ideograms at the top were constructed based on the signal patterns of chromosomes. The numbers at the bottom indicate chromosome counts. Chromosomes 15 and 16 are SAT chromosomes.

