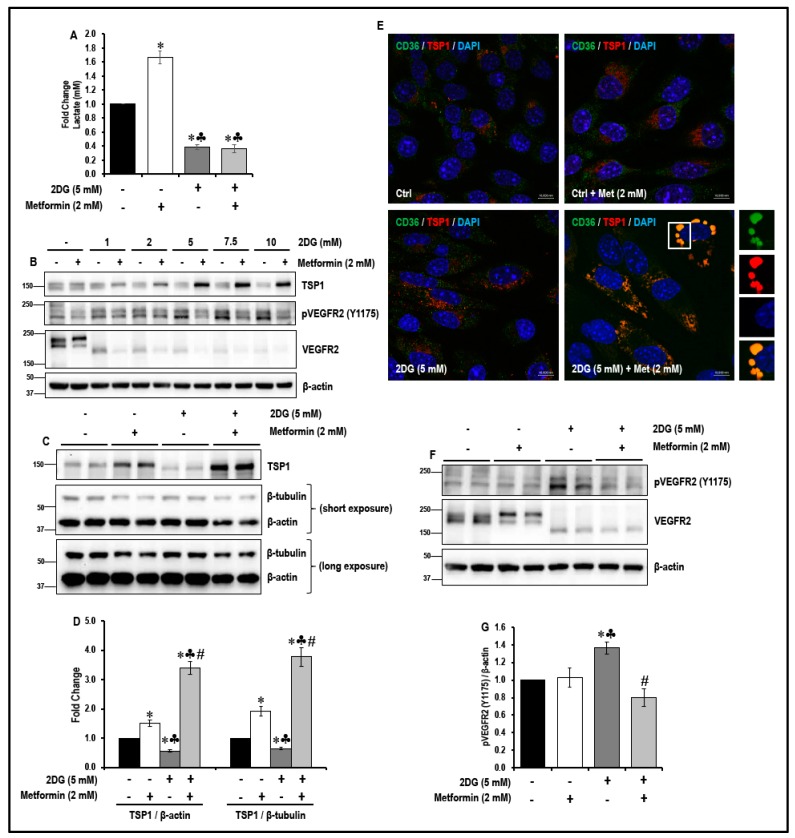
Figure 2.
Effect of metformin treatment on glycolysis, levels of TSP1, TSP1-platelet glycoprotein IV/scavenger receptor class B member 3 (CD36) co-localization and levels of phosphorylated vascular endothelial growth factor receptor-2 (pVEGFR2; Y1175) in normal glucose and 2-deoxyglucose (2DG)-exposed MMECs (48 h): Bar graphs (A) represent fold change in the levels of lactate (mM) in the cells treated with 2DG (5 mM) with or without metformin (2 mM), after 48 h in culture. Representative Western blots (B) show the levels of TSP1, pVEGFR2 (Y1175) and VEGFR2 in MMECs treated with varying concentrations of 2DG with or without metformin (2 mM), after 48 h in culture. Representative Western blots (C) show the levels of TSP1 while (F) show the levels of pVEGFR2 (Y1175) and VEGFR2 in cells exposed to 2DG (5 mM) in the presence or absence of metformin (2 mM), after 48 h in culture. Non-treated cells and cells treated with metformin (2 mM) alone were used as suitable controls. Bar graphs (D) represent levels of TSP1/β-actin and TSP1/β-tubulin (normalized against β-actin and β-tubulin loading controls) while bar graphs (G) represent ratio of pVEGFR2 (Y1175)/β-actin in the cells treated with 2DG (5 mM) with or without metformin (2 mM), after 48 h in culture. * p < 0.05 indicates significance when compared to non-treated controls, ♣ p < 0.05 indicates significance when compared to control + 2 mM metformin-treated cells and # p < 0.05 indicates significance when compared to 2DG (5 mM)-treated cells. Representative immunofluorescence confocal images (E; from three experiments) show TSP1 (red) and CD36 (green) staining in MMECs exposed to 2DG (5 mM) in the presence or absence of metformin (2 mM). Nuclear stain, 4′,6-diamidino-2-phenylindole (DAPI; blue), has been used to stain the nuclei. Scale bar = 10 μm.

