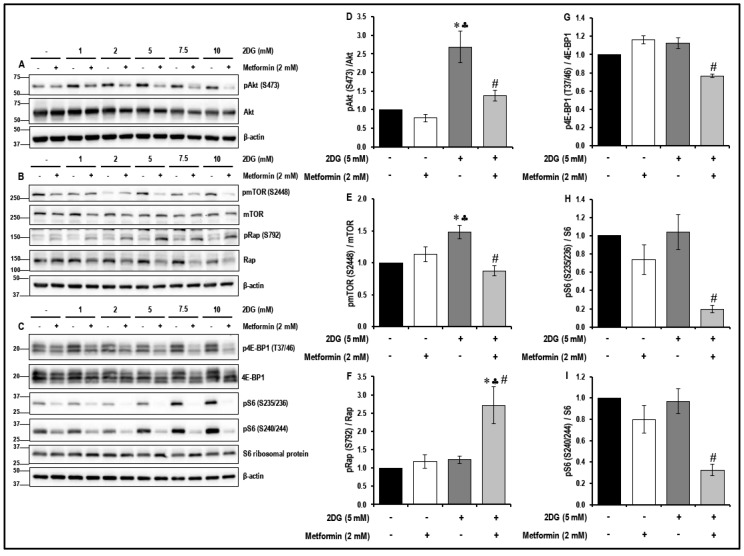
Figure 3.
The levels of protein kinase B/mammalian target of rapamycin (Akt/mTOR) pathway-related proteins in metformin-treated normal glucose- and 2DG-exposed MMECs (48 h): Representative Western blot images (A) show the levels of phosphorylated Akt (S473) and Akt, (B) show the levels of phosphorylated mTOR (S2448), mTOR, phosphorylated Raptor-pRap (S792) and Raptor (Rap) and (C) show the levels of phosphorylated eukaryotic translation initiation factor 4E (eIF4E)-binding protein 1-p4E-BP1 (T37/46), 4E-BP1, phosphorylated-S6 ribosomal protein-pS6 (S235/236), pS6 (S240/244), S6 ribosomal protein after 48 h in culture. Non-treated cells and cells treated with metformin (2 mM) alone were used as suitable controls. Bar graphs represent the ratio of (normalized against β-actin loading controls) (D) pAkt (S473)/Akt, (E) pmTOR (S2448)/mTOR, (F) pRap (S792)/Rap, (G) p4E-BP1 (T37/46)/4E-BP1, (H) pS6 (S235/236)/S6 ribosomal protein and (I) pS6 (S240/244)/S6 ribosomal protein after 48 h in culture. * p < 0.05 indicates significance when compared to non-treated controls, ♣ p < 0.05 indicates significance when compared to control + 2 mM metformin-treated cells and # p < 0.05 indicates significance when compared to 2DG (5 mM)-treated cells.

