Figure 6.
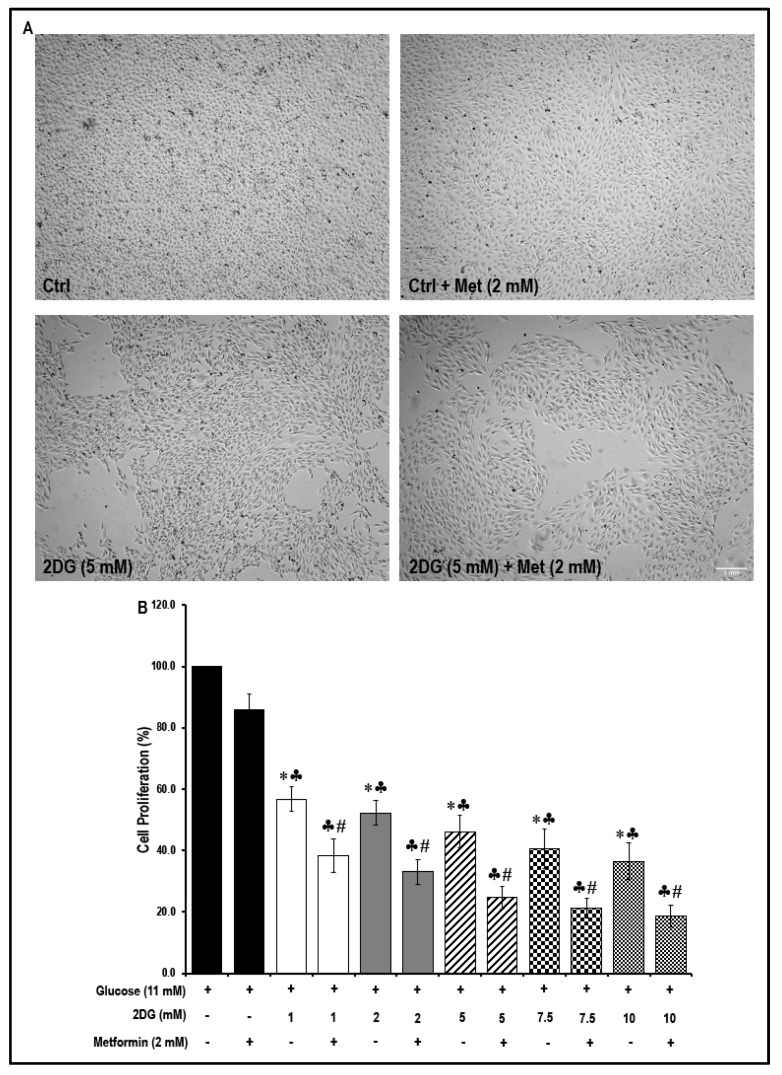
Morphology of MMECs during the different treatment conditions and the effect of metformin treatment on cell proliferation in normal glucose- and 2DG-exposed MMECs (48 h): Representative microscopic images (A; from four experiments) show the morphology of MMECs under the different treatment conditions after 48 h in culture. The bar graph (B) shows the rate of cell proliferation in MMECs treated with varying concentrations of 2DG with or without metformin (2 mM), after 48 h in culture. Non-treated cells and cells treated with metformin (2 mM) alone were used as suitable controls. * p < 0.05 was considered significant when compared to non-treated controls, ♣ p < 0.05 was considered significant when 2DG treatment was compared to the metformin (only)-treated cells. # p < 0.05 was considered significant when the combination treatment, 2DG + Met, was compared to is respective 2DG (only)-treated cells. For example, # p < 0.05 was considered significant when; 2DG (1 mM) + Met (2 mM) was compared to 2DG (1 mM); 2DG (2 mM) + Met (2 mM) was compared to 2DG (2 mM); 2DG (5 mM) + Met (2 mM) was compared to 2DG (5 mM). Scale bar = 1000 μm.

